29
/
en
AIzaSyAYiBZKx7MnpbEhh9jyipgxe19OcubqV5w
April 1, 2024
286383
Zambia
ZMB
true
2
1
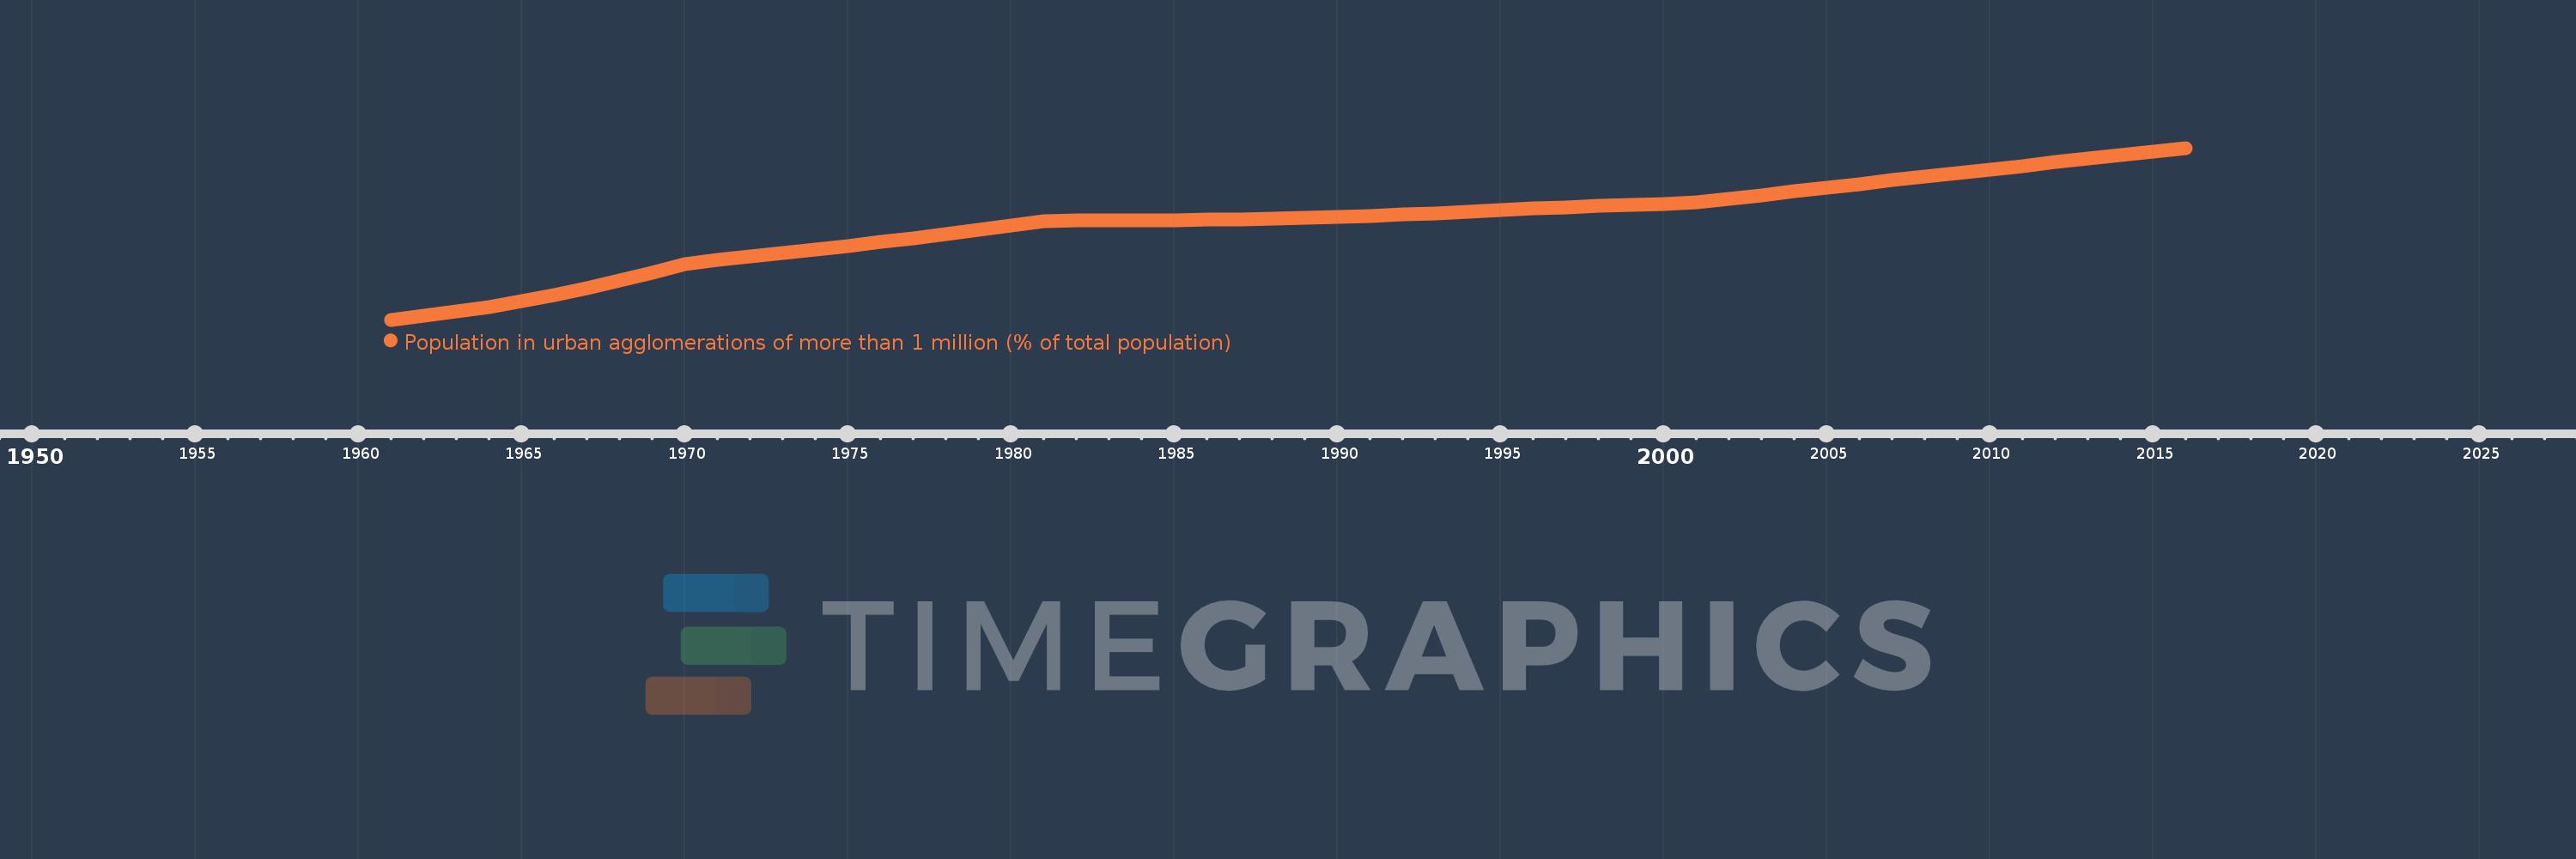
Population in urban agglomerations of more than 1 million (% of total population)
2016,2015,2014,2013,2012,2011,2010,2009,2008,2007,2006,2005,2004,2003,2002,2001,2000,1999,1998,1997,1996,1995,1994,1993,1992,1991,1990,1989,1988,1987,1986,1985,1984,1983,1982,1981,1980,1979,1978,1977,1976,1975,1974,1973,1972,1971,1970,1969,1968,1967,1966,1965,1964,1963,1962,1961
This statistics in other country:
Timeline:
This timeline shows a graph from 1961 to 2016 of Zambia. No data until 1960. Number of actual observations by date: 56.
Source name:
World Development Indicators
Source organization:
United Nations, World Urbanization Prospects.
Categories, topics:
Climate Change, Urban Development
Last updated:
apr 23, 2017
Indicators value changes by year
Maximum:
13.444
jan 1, 2016
At the date of observation
Value
Absolute change
Change from previous value
jan 1, 1961
2.982
+2.982
0.0%
jan 1, 1962
3.22
+0.238
7.98%
jan 1, 1963
3.476
+0.256
7.94%
jan 1, 1964
3.758
+0.283
8.13%
jan 1, 1965
4.107
+0.349
9.28%
jan 1, 1966
4.486
+0.379
9.22%
jan 1, 1967
4.9
+0.414
9.23%
jan 1, 1968
5.351
+0.451
9.21%
jan 1, 1969
5.843
+0.492
9.19%
jan 1, 1970
6.374
+0.531
9.09%
jan 1, 1971
6.631
+0.257
4.03%
jan 1, 1972
6.84
+0.209
3.15%
jan 1, 1973
7.052
+0.212
3.1%
jan 1, 1974
7.267
+0.215
3.05%
jan 1, 1975
7.489
+0.221
3.05%
jan 1, 1976
7.717
+0.229
3.05%
jan 1, 1977
7.955
+0.237
3.08%
jan 1, 1978
8.199
+0.245
3.08%
jan 1, 1979
8.453
+0.254
3.1%
jan 1, 1980
8.715
+0.262
3.1%
jan 1, 1981
8.987
+0.271
3.11%
jan 1, 1982
9.013
+0.026
0.29%
jan 1, 1983
9.018
+0.005
0.06%
jan 1, 1984
9.027
+0.009
0.1%
jan 1, 1985
9.042
+0.016
0.17%
jan 1, 1986
9.065
+0.022
0.25%
jan 1, 1987
9.095
+0.03
0.33%
jan 1, 1988
9.132
+0.037
0.41%
jan 1, 1989
9.179
+0.046
0.51%
jan 1, 1990
9.234
+0.056
0.61%
jan 1, 1991
9.301
+0.067
0.73%
jan 1, 1992
9.38
+0.079
0.84%
jan 1, 1993
9.469
+0.089
0.95%
jan 1, 1994
9.562
+0.093
0.99%
jan 1, 1995
9.655
+0.093
0.97%
jan 1, 1996
9.744
+0.088
0.91%
jan 1, 1997
9.825
+0.082
0.84%
jan 1, 1998
9.901
+0.076
0.77%
jan 1, 1999
9.976
+0.075
0.75%
jan 1, 2000
10.054
+0.078
0.79%
jan 1, 2001
10.14
+0.086
0.85%
jan 1, 2002
10.322
+0.183
1.8%
jan 1, 2003
10.553
+0.231
2.24%
jan 1, 2004
10.789
+0.236
2.24%
jan 1, 2005
11.026
+0.236
2.19%
jan 1, 2006
11.256
+0.23
2.09%
jan 1, 2007
11.481
+0.225
2.0%
jan 1, 2008
11.702
+0.221
1.92%
jan 1, 2009
11.92
+0.218
1.86%
jan 1, 2010
12.135
+0.215
1.8%
jan 1, 2011
12.351
+0.216
1.78%
jan 1, 2012
12.566
+0.216
1.75%
jan 1, 2013
12.783
+0.216
1.72%
jan 1, 2014
13.0
+0.218
1.7%
jan 1, 2015
13.22
+0.22
1.69%
jan 1, 2016
13.444
+0.223
1.69%
Ranking of countries by current statistics by years


Comments: