29
/
en
AIzaSyAYiBZKx7MnpbEhh9jyipgxe19OcubqV5w
April 1, 2024
231534
Rwanda
RWA
true
2
1
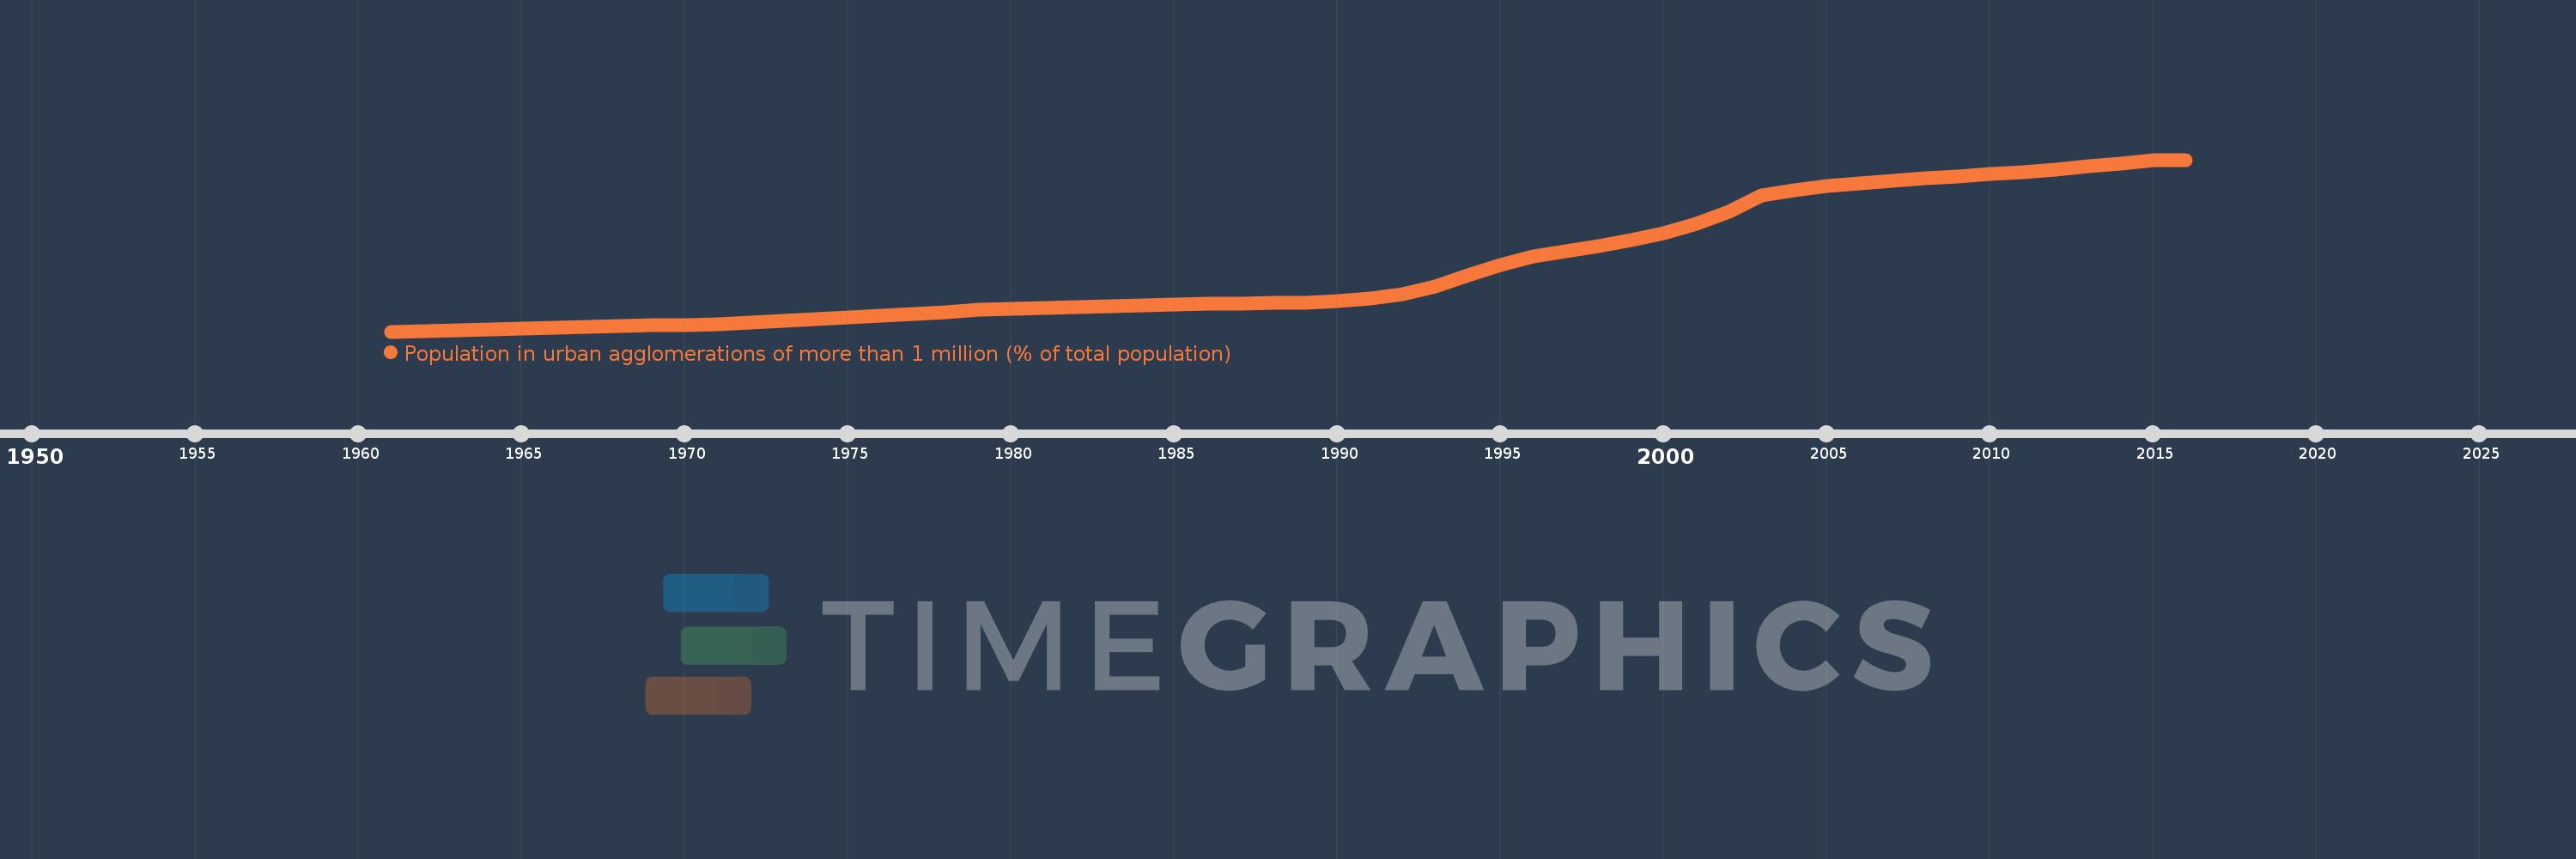
Population in urban agglomerations of more than 1 million (% of total population)
2016,2015,2014,2013,2012,2011,2010,2009,2008,2007,2006,2005,2004,2003,2002,2001,2000,1999,1998,1997,1996,1995,1994,1993,1992,1991,1990,1989,1988,1987,1986,1985,1984,1983,1982,1981,1980,1979,1978,1977,1976,1975,1974,1973,1972,1971,1970,1969,1968,1967,1966,1965,1964,1963,1962,1961
This statistics in other country:
Timeline:
This timeline shows a graph from 1961 to 2016 of Rwanda. No data until 1960. Number of actual observations by date: 56.
Source name:
World Development Indicators
Source organization:
United Nations, World Urbanization Prospects.
Categories, topics:
Climate Change, Urban Development
Last updated:
apr 23, 2017
Indicators value changes by year
Maximum:
10.827
jan 1, 2016
At the date of observation
Value
Absolute change
Change from previous value
jan 1, 1961
1.17
+1.17
0.0%
jan 1, 1962
1.21
+0.04
3.42%
jan 1, 1963
1.255
+0.045
3.75%
jan 1, 1964
1.304
+0.048
3.85%
jan 1, 1965
1.352
+0.048
3.68%
jan 1, 1966
1.396
+0.045
3.3%
jan 1, 1967
1.437
+0.04
2.9%
jan 1, 1968
1.474
+0.037
2.57%
jan 1, 1969
1.509
+0.035
2.38%
jan 1, 1970
1.544
+0.035
2.34%
jan 1, 1971
1.582
+0.038
2.43%
jan 1, 1972
1.664
+0.082
5.18%
jan 1, 1973
1.755
+0.091
5.49%
jan 1, 1974
1.851
+0.096
5.47%
jan 1, 1975
1.951
+0.1
5.42%
jan 1, 1976
2.055
+0.104
5.32%
jan 1, 1977
2.163
+0.108
5.24%
jan 1, 1978
2.274
+0.111
5.14%
jan 1, 1979
2.39
+0.116
5.09%
jan 1, 1980
2.447
+0.057
2.38%
jan 1, 1981
2.495
+0.048
1.98%
jan 1, 1982
2.546
+0.051
2.06%
jan 1, 1983
2.602
+0.056
2.19%
jan 1, 1984
2.657
+0.055
2.1%
jan 1, 1985
2.704
+0.047
1.77%
jan 1, 1986
2.74
+0.036
1.35%
jan 1, 1987
2.759
+0.019
0.69%
jan 1, 1988
2.768
+0.009
0.31%
jan 1, 1989
2.794
+0.026
0.93%
jan 1, 1990
2.869
+0.076
2.71%
jan 1, 1991
3.019
+0.149
5.2%
jan 1, 1992
3.27
+0.251
8.31%
jan 1, 1993
3.726
+0.457
13.96%
jan 1, 1994
4.309
+0.583
15.65%
jan 1, 1995
4.915
+0.606
14.07%
jan 1, 1996
5.411
+0.496
10.08%
jan 1, 1997
5.697
+0.285
5.28%
jan 1, 1998
5.979
+0.282
4.95%
jan 1, 1999
6.299
+0.32
5.35%
jan 1, 2000
6.678
+0.379
6.02%
jan 1, 2001
7.207
+0.529
7.92%
jan 1, 2002
7.919
+0.712
9.88%
jan 1, 2003
8.815
+0.896
11.31%
jan 1, 2004
9.12
+0.305
3.46%
jan 1, 2005
9.334
+0.214
2.35%
jan 1, 2006
9.516
+0.182
1.95%
jan 1, 2007
9.66
+0.144
1.51%
jan 1, 2008
9.784
+0.124
1.28%
jan 1, 2009
9.897
+0.113
1.16%
jan 1, 2010
10.013
+0.116
1.17%
jan 1, 2011
10.144
+0.131
1.31%
jan 1, 2012
10.289
+0.146
1.43%
jan 1, 2013
10.446
+0.156
1.52%
jan 1, 2014
10.61
+0.164
1.57%
jan 1, 2015
10.78
+0.17
1.6%
jan 1, 2016
10.827
+0.048
0.44%
Ranking of countries by current statistics by years


Comments: