29
/
en
AIzaSyAYiBZKx7MnpbEhh9jyipgxe19OcubqV5w
April 1, 2024
95273
Burkina Faso
BFA
true
2
1
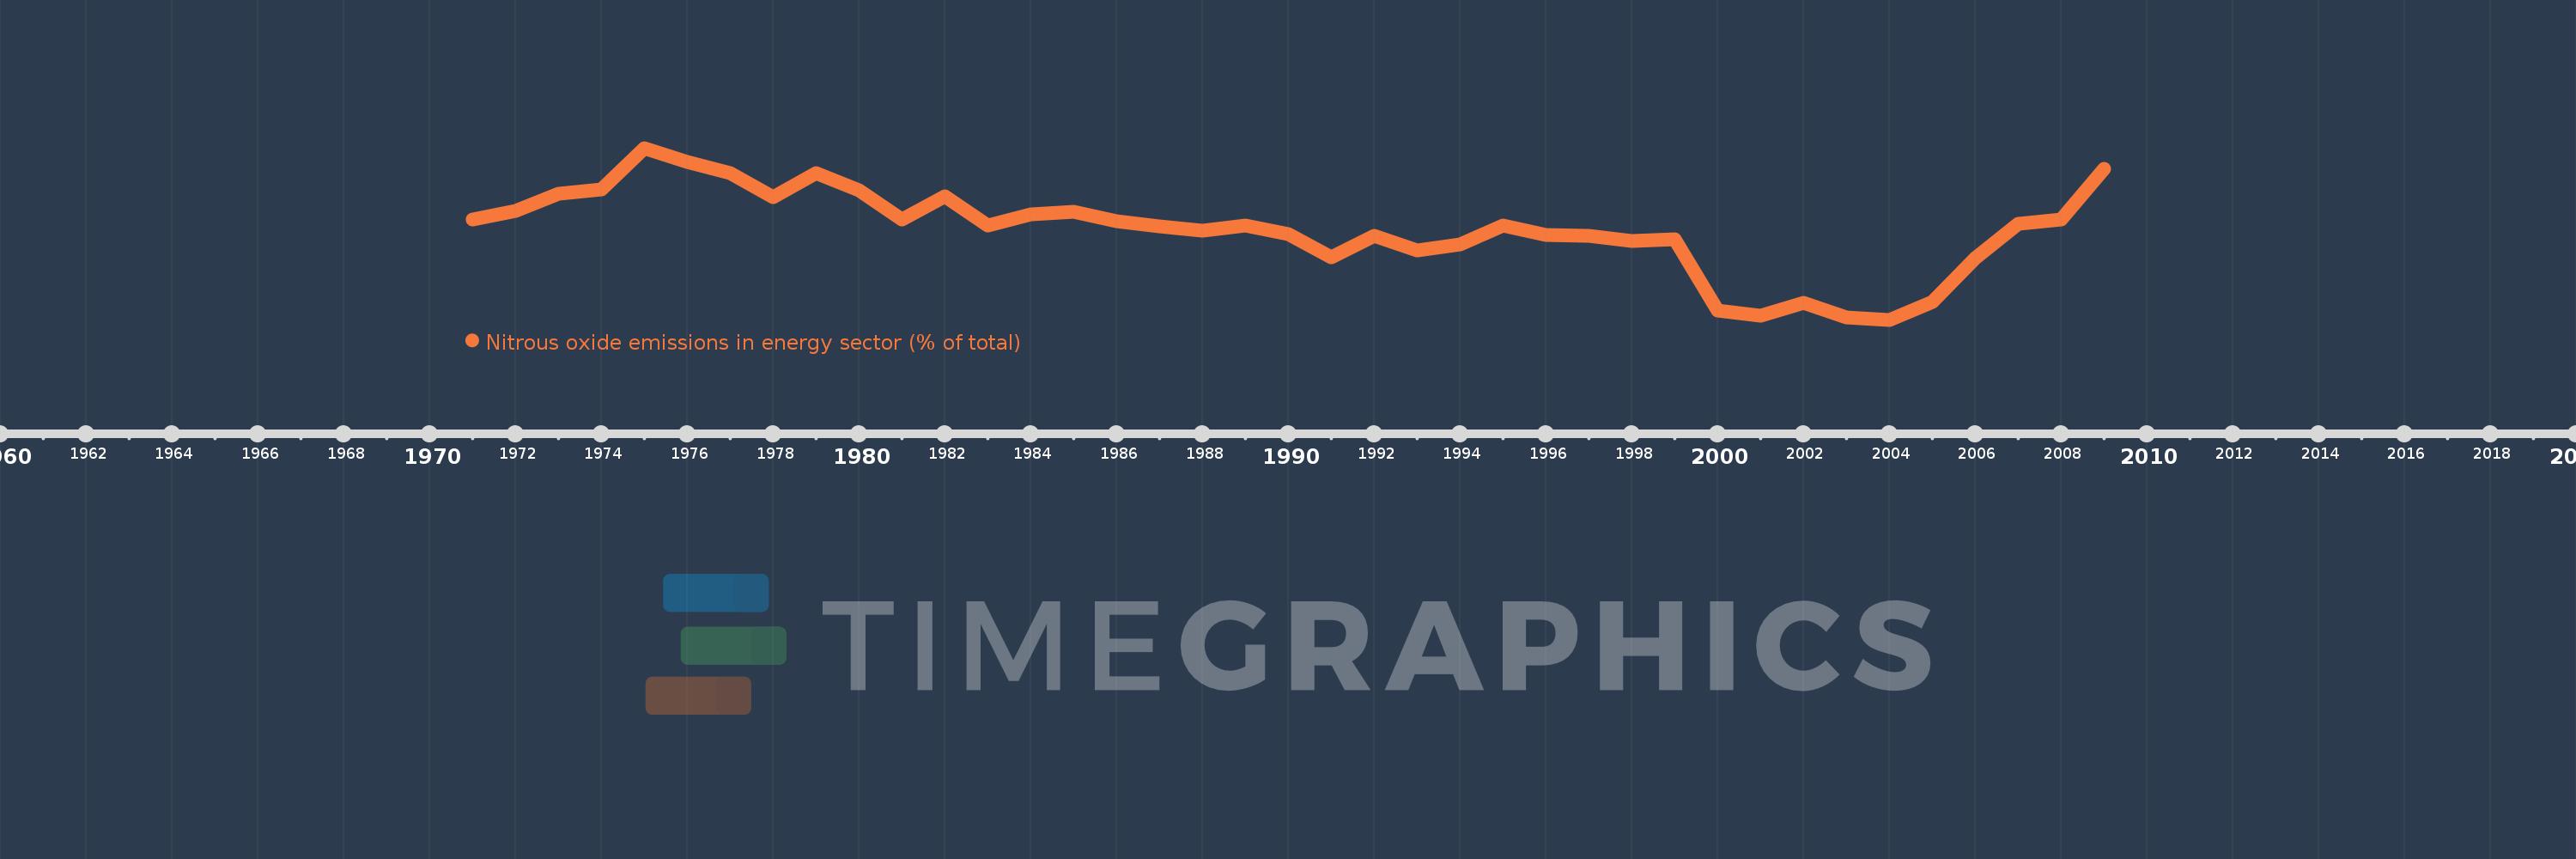
Nitrous oxide emissions in energy sector (% of total)
2009,2008,2007,2006,2005,2004,2003,2002,2001,2000,1999,1998,1997,1996,1995,1994,1993,1992,1991,1990,1989,1988,1987,1986,1985,1984,1983,1982,1981,1980,1979,1978,1977,1976,1975,1974,1973,1972,1971
This statistics in other country:
AfghanistanAlbaniaAlgeriaAmerican SamoaAndorraAngolaAntigua and BarbudaArab WorldArgentinaArmeniaArubaAustraliaAustriaAzerbaijanBahamas, TheBahrainBangladeshBarbadosBelarusBelgiumBelizeBeninBermudaBhutanBoliviaBosnia and HerzegovinaBotswanaBrazilBritish Virgin IslandsBrunei DarussalamBulgariaBurkina FasoBurundiCabo VerdeCambodiaCameroonCanadaCaribbean small statesCayman IslandsCentral African RepublicCentral Europe and the BalticsChadChileChinaColombiaComorosCongo, Dem. Rep.Congo, Rep.Costa RicaCote d'IvoireCroatiaCubaCyprusCzech RepublicDenmarkDjiboutiDominicaDominican RepublicEarly-demographic dividendEast Asia & PacificEast Asia & Pacific (excluding high income)East Asia & Pacific (IDA & IBRD countries)EcuadorEgypt, Arab Rep.El SalvadorEquatorial GuineaEritreaEstoniaEthiopiaEuro areaEurope & Central AsiaEurope & Central Asia (excluding high income)Europe & Central Asia (IDA & IBRD countries)European UnionFaroe IslandsFijiFinlandFragile and conflict affected situationsFranceFrench PolynesiaGabonGambia, TheGeorgiaGermanyGhanaGibraltarGreeceGreenlandGrenadaGuamGuatemalaGuineaGuinea-BissauGuyanaHaitiHeavily indebted poor countries (HIPC)High incomeHondurasHong Kong SAR, ChinaHungaryIBRD onlyIcelandIDA & IBRD totalIDA blendIDA onlyIDA totalIndiaIndonesiaIran, Islamic Rep.IraqIrelandIsraelItalyJamaicaJapanJordanKazakhstanKenyaKiribatiKorea, Dem. People’s Rep.Korea, Rep.KuwaitKyrgyz RepublicLao PDRLate-demographic dividendLatin America & Caribbean Latin America & Caribbean (excluding high income)Latin America & the Caribbean (IDA & IBRD countries)LatviaLeast developed countries: UN classificationLebanonLesothoLiberiaLibyaLithuaniaLow & middle incomeLow incomeLower middle incomeLuxembourgMacao SAR, ChinaMacedonia, FYRMadagascarMalawiMalaysiaMaldivesMaliMaltaMarshall IslandsMauritaniaMauritiusMexicoMicronesia, Fed. Sts.Middle East & North AfricaMiddle East & North Africa (excluding high income)Middle East & North Africa (IDA & IBRD countries)Middle incomeMoldovaMongoliaMoroccoMozambiqueMyanmarNamibiaNauruNepalNetherlandsNew CaledoniaNew ZealandNicaraguaNigerNigeriaNorth AmericaNorthern Mariana IslandsNorwayOECD membersOmanOther small statesPacific island small statesPakistanPalauPanamaPapua New GuineaParaguayPeruPhilippinesPolandPortugalPost-demographic dividendPre-demographic dividendPuerto RicoQatarRomaniaRussian FederationRwandaSamoaSao Tome and PrincipeSaudi ArabiaSenegalSerbiaSeychellesSierra LeoneSingaporeSlovak RepublicSloveniaSmall statesSolomon IslandsSomaliaSouth AfricaSouth AsiaSouth Asia (IDA & IBRD)SpainSri LankaSt. Kitts and NevisSt. LuciaSt. Vincent and the GrenadinesSub-Saharan Africa Sub-Saharan Africa (excluding high income)Sub-Saharan Africa (IDA & IBRD countries)SudanSurinameSwazilandSwedenSwitzerlandSyrian Arab RepublicTajikistanTanzaniaThailandTimor-LesteTogoTongaTrinidad and TobagoTunisiaTurkeyTurkmenistanTurks and Caicos IslandsTuvaluUgandaUkraineUnited Arab EmiratesUnited KingdomUnited StatesUpper middle incomeUruguayUzbekistanVanuatuVenezuela, RBVietnamVirgin Islands (U.S.)WorldYemen, Rep.ZambiaZimbabwe Timeline:
This timeline shows a graph from 1971 to 2009 of Burkina Faso. No data until 1970. Number of actual observations by date: 39.
Source name:
World Development Indicators
Source organization:
World Bank staff estimates from original source: European Commission, Joint Research Centre (JRC)/Netherlands Environmental Assessment Agency (PBL). Emission Database for Global Atmospheric Research (EDGAR): http://edgar.jrc.ec.europa.eu/.
Categories, topics:
Energy & Mining, Environment
Last updated:
apr 23, 2017
Indicators value changes by year
At the date of observation
Value
Absolute change
Change from previous value
jan 1, 1971
4.623
+4.623
0.0%
jan 1, 1972
4.772
+0.149
3.22%
jan 1, 1973
5.066
+0.294
6.16%
jan 1, 1974
5.139
+0.072
1.43%
jan 1, 1975
5.854
+0.715
13.92%
jan 1, 1976
5.608
-0.246
-4.2%
jan 1, 1977
5.412
-0.196
-3.5%
jan 1, 1978
4.997
-0.415
-7.67%
jan 1, 1979
5.423
+0.426
8.52%
jan 1, 1980
5.124
-0.299
-5.51%
jan 1, 1981
4.611
-0.513
-10.01%
jan 1, 1982
5.017
+0.406
8.8%
jan 1, 1983
4.508
-0.509
-10.15%
jan 1, 1984
4.701
+0.193
4.28%
jan 1, 1985
4.752
+0.051
1.09%
jan 1, 1986
4.592
-0.16
-3.37%
jan 1, 1987
4.502
-0.09
-1.96%
jan 1, 1988
4.425
-0.078
-1.72%
jan 1, 1989
4.513
+0.088
1.99%
jan 1, 1990
4.359
-0.154
-3.42%
jan 1, 1991
3.968
-0.391
-8.96%
jan 1, 1992
4.332
+0.364
9.17%
jan 1, 1993
4.087
-0.245
-5.66%
jan 1, 1994
4.182
+0.096
2.34%
jan 1, 1995
4.511
+0.329
7.86%
jan 1, 1996
4.347
-0.164
-3.63%
jan 1, 1997
4.329
-0.018
-0.42%
jan 1, 1998
4.244
-0.085
-1.97%
jan 1, 1999
4.273
+0.029
0.69%
jan 1, 2000
3.034
-1.24
-29.01%
jan 1, 2001
2.956
-0.078
-2.56%
jan 1, 2002
3.173
+0.217
7.34%
jan 1, 2003
2.929
-0.244
-7.69%
jan 1, 2004
2.882
-0.047
-1.59%
jan 1, 2005
3.188
+0.306
10.61%
jan 1, 2006
3.941
+0.753
23.62%
jan 1, 2007
4.536
+0.595
15.09%
jan 1, 2008
4.614
+0.078
1.71%
jan 1, 2009
5.486
+0.872
18.91%
Ranking of countries by current statistics by years


Comments: