29
/
en
AIzaSyAYiBZKx7MnpbEhh9jyipgxe19OcubqV5w
April 1, 2024
272684
Uganda
UGA
true
2
1
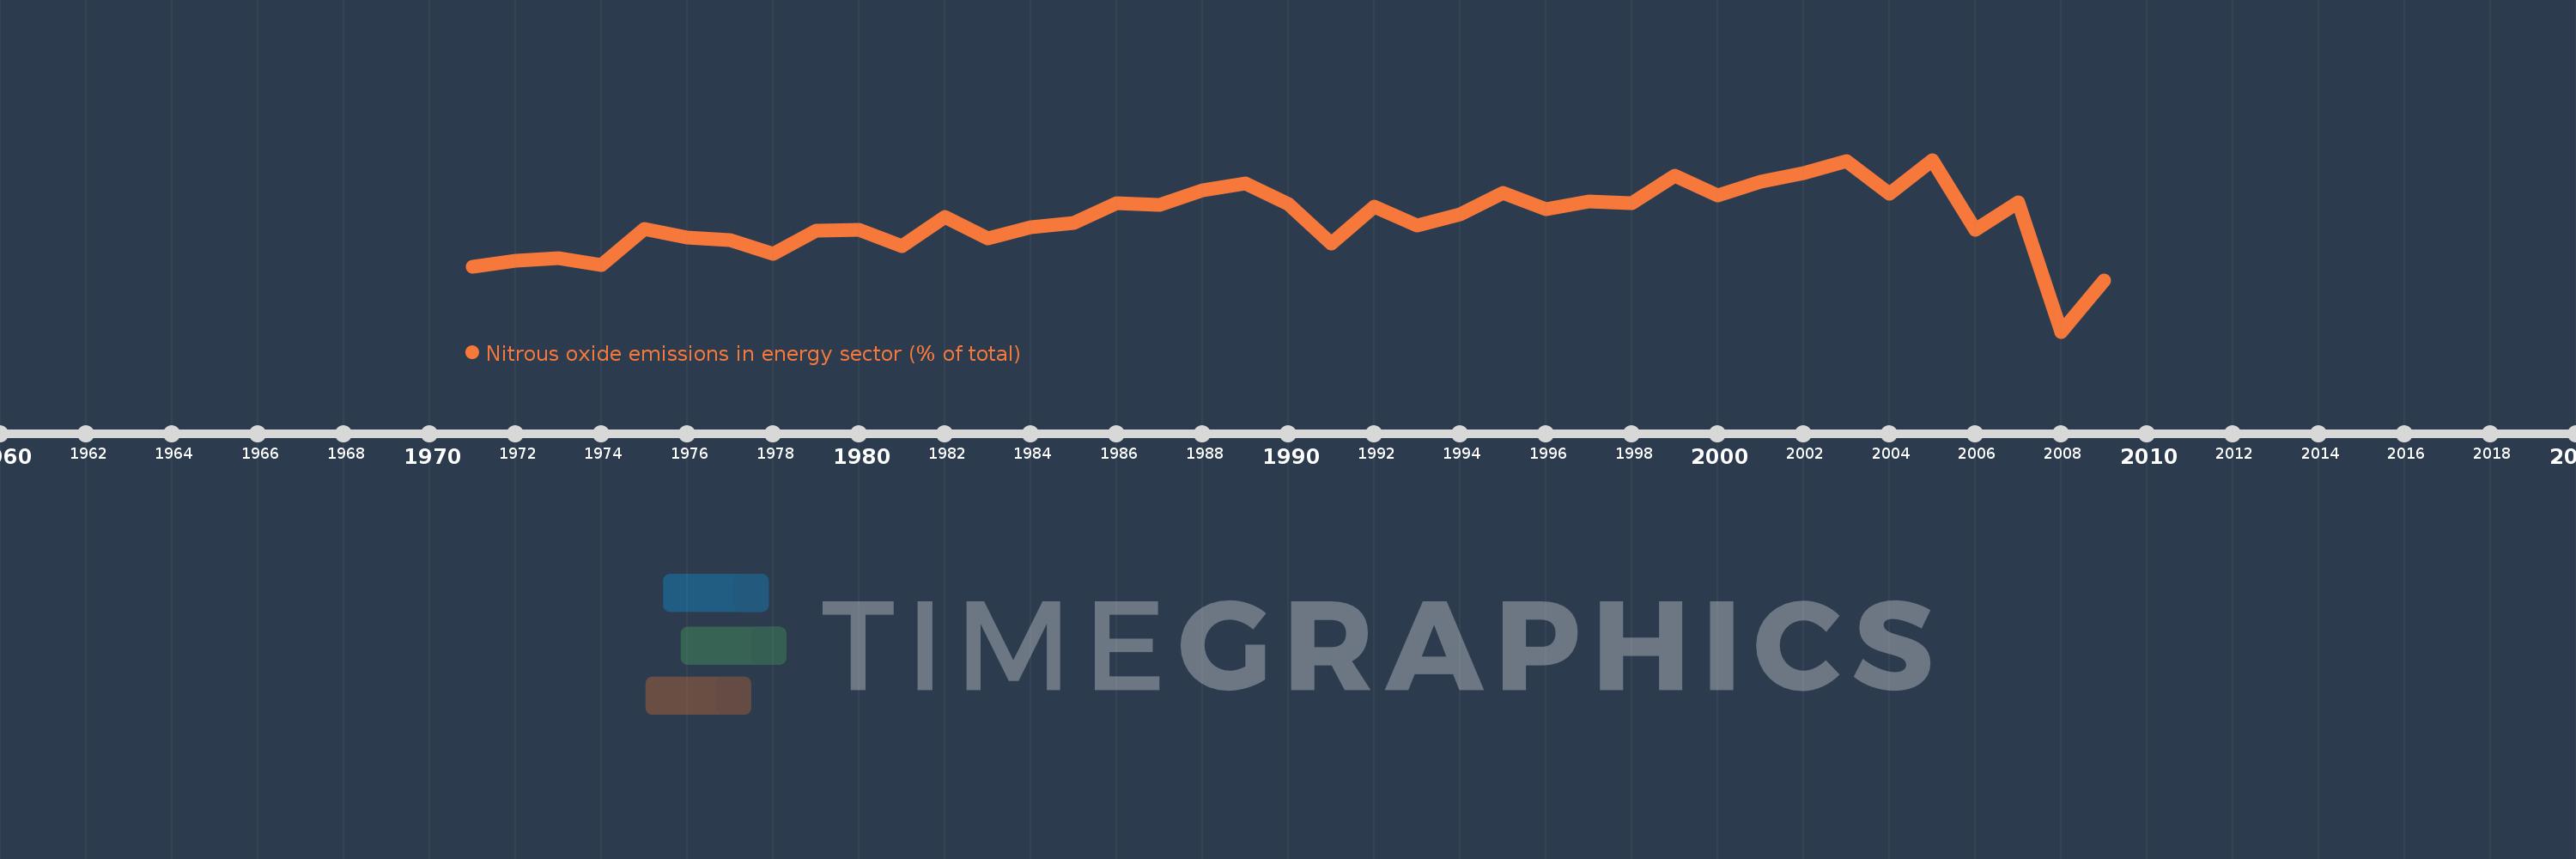
Nitrous oxide emissions in energy sector (% of total)
2009,2008,2007,2006,2005,2004,2003,2002,2001,2000,1999,1998,1997,1996,1995,1994,1993,1992,1991,1990,1989,1988,1987,1986,1985,1984,1983,1982,1981,1980,1979,1978,1977,1976,1975,1974,1973,1972,1971
This statistics in other country:
AfghanistanAlbaniaAlgeriaAmerican SamoaAndorraAngolaAntigua and BarbudaArab WorldArgentinaArmeniaArubaAustraliaAustriaAzerbaijanBahamas, TheBahrainBangladeshBarbadosBelarusBelgiumBelizeBeninBermudaBhutanBoliviaBosnia and HerzegovinaBotswanaBrazilBritish Virgin IslandsBrunei DarussalamBulgariaBurkina FasoBurundiCabo VerdeCambodiaCameroonCanadaCaribbean small statesCayman IslandsCentral African RepublicCentral Europe and the BalticsChadChileChinaColombiaComorosCongo, Dem. Rep.Congo, Rep.Costa RicaCote d'IvoireCroatiaCubaCyprusCzech RepublicDenmarkDjiboutiDominicaDominican RepublicEarly-demographic dividendEast Asia & PacificEast Asia & Pacific (excluding high income)East Asia & Pacific (IDA & IBRD countries)EcuadorEgypt, Arab Rep.El SalvadorEquatorial GuineaEritreaEstoniaEthiopiaEuro areaEurope & Central AsiaEurope & Central Asia (excluding high income)Europe & Central Asia (IDA & IBRD countries)European UnionFaroe IslandsFijiFinlandFragile and conflict affected situationsFranceFrench PolynesiaGabonGambia, TheGeorgiaGermanyGhanaGibraltarGreeceGreenlandGrenadaGuamGuatemalaGuineaGuinea-BissauGuyanaHaitiHeavily indebted poor countries (HIPC)High incomeHondurasHong Kong SAR, ChinaHungaryIBRD onlyIcelandIDA & IBRD totalIDA blendIDA onlyIDA totalIndiaIndonesiaIran, Islamic Rep.IraqIrelandIsraelItalyJamaicaJapanJordanKazakhstanKenyaKiribatiKorea, Dem. People’s Rep.Korea, Rep.KuwaitKyrgyz RepublicLao PDRLate-demographic dividendLatin America & Caribbean Latin America & Caribbean (excluding high income)Latin America & the Caribbean (IDA & IBRD countries)LatviaLeast developed countries: UN classificationLebanonLesothoLiberiaLibyaLithuaniaLow & middle incomeLow incomeLower middle incomeLuxembourgMacao SAR, ChinaMacedonia, FYRMadagascarMalawiMalaysiaMaldivesMaliMaltaMarshall IslandsMauritaniaMauritiusMexicoMicronesia, Fed. Sts.Middle East & North AfricaMiddle East & North Africa (excluding high income)Middle East & North Africa (IDA & IBRD countries)Middle incomeMoldovaMongoliaMoroccoMozambiqueMyanmarNamibiaNauruNepalNetherlandsNew CaledoniaNew ZealandNicaraguaNigerNigeriaNorth AmericaNorthern Mariana IslandsNorwayOECD membersOmanOther small statesPacific island small statesPakistanPalauPanamaPapua New GuineaParaguayPeruPhilippinesPolandPortugalPost-demographic dividendPre-demographic dividendPuerto RicoQatarRomaniaRussian FederationRwandaSamoaSao Tome and PrincipeSaudi ArabiaSenegalSerbiaSeychellesSierra LeoneSingaporeSlovak RepublicSloveniaSmall statesSolomon IslandsSomaliaSouth AfricaSouth AsiaSouth Asia (IDA & IBRD)SpainSri LankaSt. Kitts and NevisSt. LuciaSt. Vincent and the GrenadinesSub-Saharan Africa Sub-Saharan Africa (excluding high income)Sub-Saharan Africa (IDA & IBRD countries)SudanSurinameSwazilandSwedenSwitzerlandSyrian Arab RepublicTajikistanTanzaniaThailandTimor-LesteTogoTongaTrinidad and TobagoTunisiaTurkeyTurkmenistanTurks and Caicos IslandsTuvaluUgandaUkraineUnited Arab EmiratesUnited KingdomUnited StatesUpper middle incomeUruguayUzbekistanVanuatuVenezuela, RBVietnamVirgin Islands (U.S.)WorldYemen, Rep.ZambiaZimbabwe Timeline:
This timeline shows a graph from 1971 to 2009 of Uganda. No data until 1970. Number of actual observations by date: 39.
Source name:
World Development Indicators
Source organization:
World Bank staff estimates from original source: European Commission, Joint Research Centre (JRC)/Netherlands Environmental Assessment Agency (PBL). Emission Database for Global Atmospheric Research (EDGAR): http://edgar.jrc.ec.europa.eu/.
Categories, topics:
Energy & Mining, Environment
Last updated:
apr 23, 2017
Indicators value changes by year
At the date of observation
Value
Absolute change
Change from previous value
jan 1, 1971
5.103
+5.103
0.0%
jan 1, 1972
5.318
+0.215
4.21%
jan 1, 1973
5.405
+0.088
1.65%
jan 1, 1974
5.167
-0.238
-4.4%
jan 1, 1975
6.374
+1.207
23.35%
jan 1, 1976
6.08
-0.294
-4.61%
jan 1, 1977
6.004
-0.076
-1.25%
jan 1, 1978
5.532
-0.472
-7.87%
jan 1, 1979
6.33
+0.798
14.43%
jan 1, 1980
6.363
+0.033
0.52%
jan 1, 1981
5.798
-0.565
-8.89%
jan 1, 1982
6.798
+1.0
17.25%
jan 1, 1983
6.068
-0.73
-10.74%
jan 1, 1984
6.438
+0.37
6.1%
jan 1, 1985
6.573
+0.136
2.11%
jan 1, 1986
7.259
+0.685
10.43%
jan 1, 1987
7.196
-0.063
-0.87%
jan 1, 1988
7.697
+0.501
6.97%
jan 1, 1989
7.914
+0.217
2.82%
jan 1, 1990
7.225
-0.689
-8.71%
jan 1, 1991
5.89
-1.335
-18.48%
jan 1, 1992
7.133
+1.243
21.1%
jan 1, 1993
6.485
-0.647
-9.07%
jan 1, 1994
6.875
+0.389
6.0%
jan 1, 1995
7.598
+0.723
10.52%
jan 1, 1996
7.056
-0.542
-7.14%
jan 1, 1997
7.307
+0.252
3.57%
jan 1, 1998
7.263
-0.044
-0.6%
jan 1, 1999
8.174
+0.911
12.54%
jan 1, 2000
7.524
-0.65
-7.95%
jan 1, 2001
7.992
+0.467
6.21%
jan 1, 2002
8.255
+0.264
3.3%
jan 1, 2003
8.673
+0.418
5.07%
jan 1, 2004
7.564
-1.109
-12.79%
jan 1, 2005
8.719
+1.154
15.26%
jan 1, 2006
6.358
-2.361
-27.08%
jan 1, 2007
7.29
+0.932
14.66%
jan 1, 2008
2.906
-4.384
-60.14%
jan 1, 2009
4.649
+1.743
59.99%
Ranking of countries by current statistics by years


Comments: