29
/
en
AIzaSyAYiBZKx7MnpbEhh9jyipgxe19OcubqV5w
April 1, 2024
228907
Romania
ROU
true
2
1
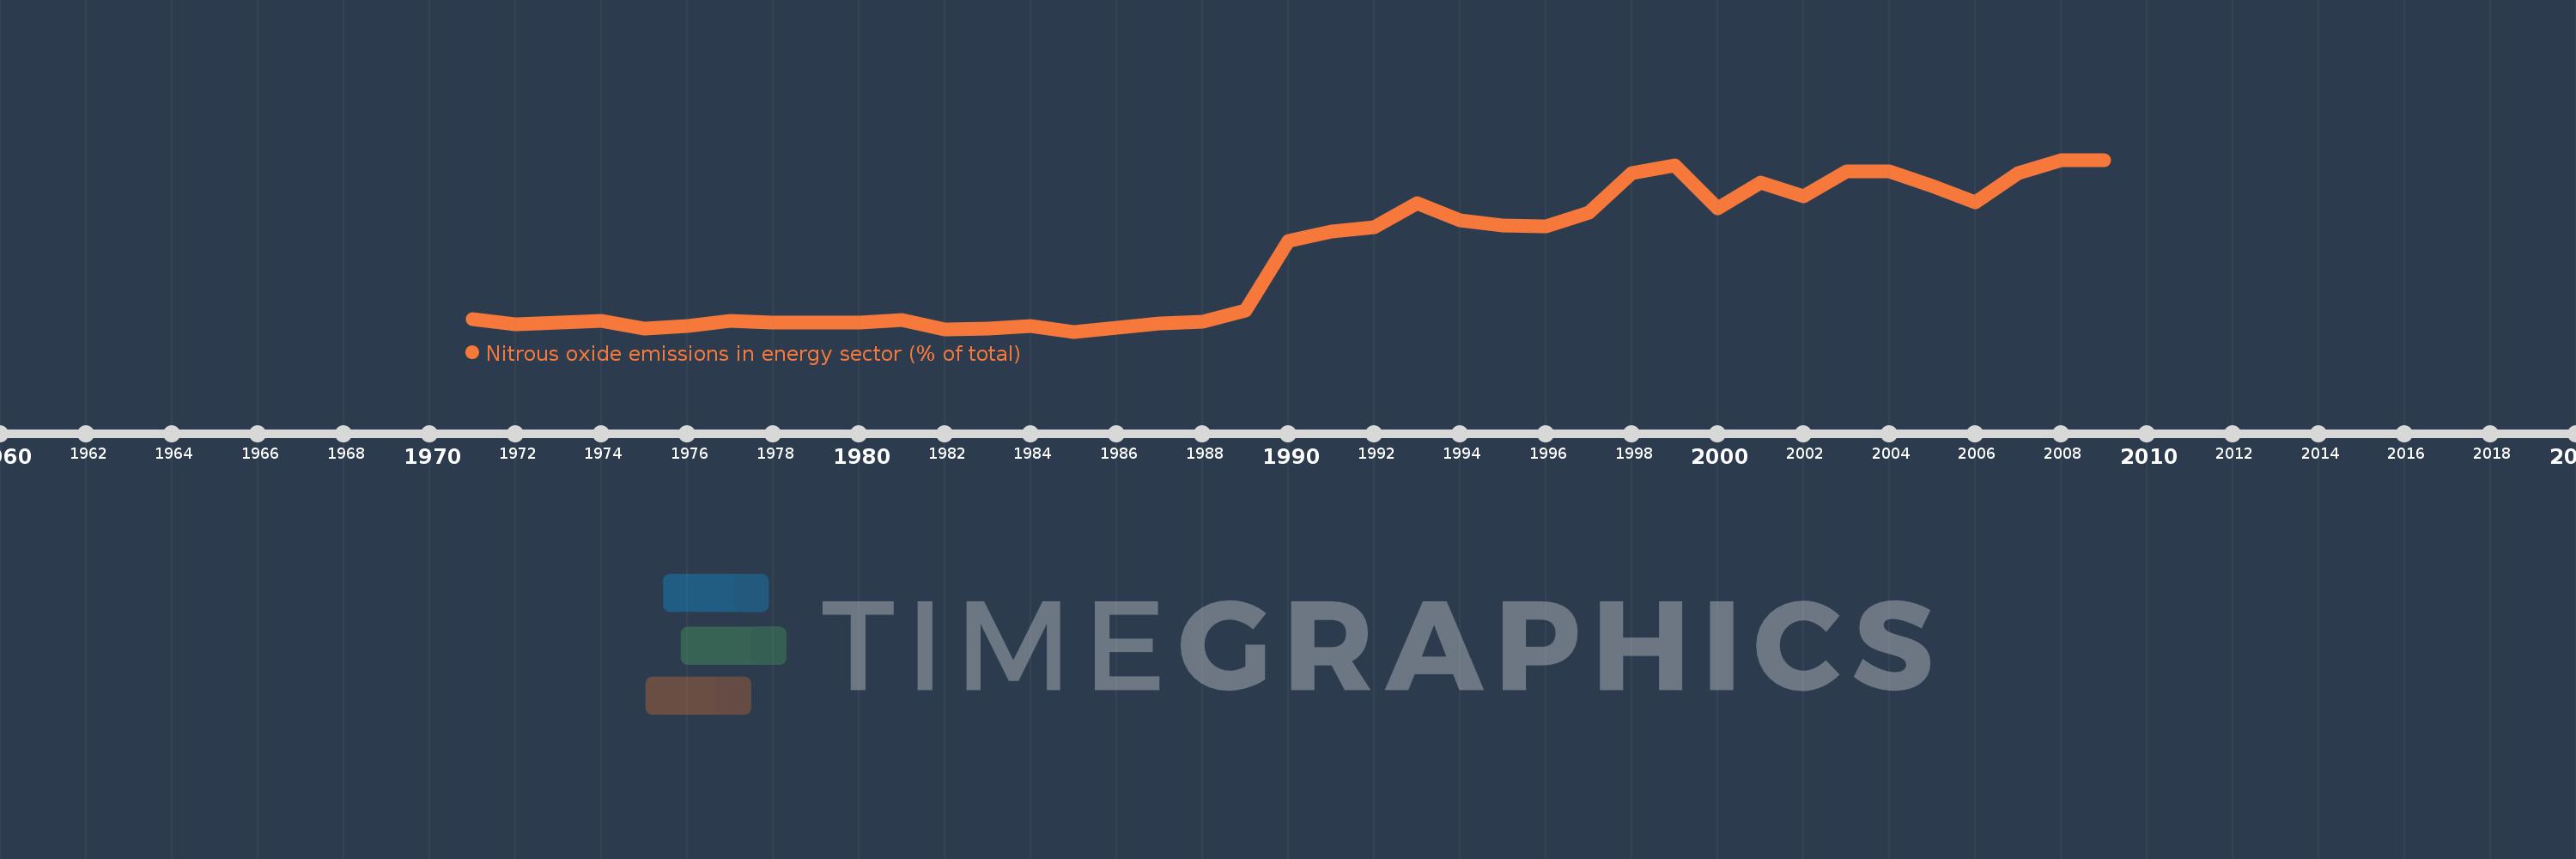
Nitrous oxide emissions in energy sector (% of total)
2009,2008,2007,2006,2005,2004,2003,2002,2001,2000,1999,1998,1997,1996,1995,1994,1993,1992,1991,1990,1989,1988,1987,1986,1985,1984,1983,1982,1981,1980,1979,1978,1977,1976,1975,1974,1973,1972,1971
This statistics in other country:
AfghanistanAlbaniaAlgeriaAmerican SamoaAndorraAngolaAntigua and BarbudaArab WorldArgentinaArmeniaArubaAustraliaAustriaAzerbaijanBahamas, TheBahrainBangladeshBarbadosBelarusBelgiumBelizeBeninBermudaBhutanBoliviaBosnia and HerzegovinaBotswanaBrazilBritish Virgin IslandsBrunei DarussalamBulgariaBurkina FasoBurundiCabo VerdeCambodiaCameroonCanadaCaribbean small statesCayman IslandsCentral African RepublicCentral Europe and the BalticsChadChileChinaColombiaComorosCongo, Dem. Rep.Congo, Rep.Costa RicaCote d'IvoireCroatiaCubaCyprusCzech RepublicDenmarkDjiboutiDominicaDominican RepublicEarly-demographic dividendEast Asia & PacificEast Asia & Pacific (excluding high income)East Asia & Pacific (IDA & IBRD countries)EcuadorEgypt, Arab Rep.El SalvadorEquatorial GuineaEritreaEstoniaEthiopiaEuro areaEurope & Central AsiaEurope & Central Asia (excluding high income)Europe & Central Asia (IDA & IBRD countries)European UnionFaroe IslandsFijiFinlandFragile and conflict affected situationsFranceFrench PolynesiaGabonGambia, TheGeorgiaGermanyGhanaGibraltarGreeceGreenlandGrenadaGuamGuatemalaGuineaGuinea-BissauGuyanaHaitiHeavily indebted poor countries (HIPC)High incomeHondurasHong Kong SAR, ChinaHungaryIBRD onlyIcelandIDA & IBRD totalIDA blendIDA onlyIDA totalIndiaIndonesiaIran, Islamic Rep.IraqIrelandIsraelItalyJamaicaJapanJordanKazakhstanKenyaKiribatiKorea, Dem. People’s Rep.Korea, Rep.KuwaitKyrgyz RepublicLao PDRLate-demographic dividendLatin America & Caribbean Latin America & Caribbean (excluding high income)Latin America & the Caribbean (IDA & IBRD countries)LatviaLeast developed countries: UN classificationLebanonLesothoLiberiaLibyaLithuaniaLow & middle incomeLow incomeLower middle incomeLuxembourgMacao SAR, ChinaMacedonia, FYRMadagascarMalawiMalaysiaMaldivesMaliMaltaMarshall IslandsMauritaniaMauritiusMexicoMicronesia, Fed. Sts.Middle East & North AfricaMiddle East & North Africa (excluding high income)Middle East & North Africa (IDA & IBRD countries)Middle incomeMoldovaMongoliaMoroccoMozambiqueMyanmarNamibiaNauruNepalNetherlandsNew CaledoniaNew ZealandNicaraguaNigerNigeriaNorth AmericaNorthern Mariana IslandsNorwayOECD membersOmanOther small statesPacific island small statesPakistanPalauPanamaPapua New GuineaParaguayPeruPhilippinesPolandPortugalPost-demographic dividendPre-demographic dividendPuerto RicoQatarRomaniaRussian FederationRwandaSamoaSao Tome and PrincipeSaudi ArabiaSenegalSerbiaSeychellesSierra LeoneSingaporeSlovak RepublicSloveniaSmall statesSolomon IslandsSomaliaSouth AfricaSouth AsiaSouth Asia (IDA & IBRD)SpainSri LankaSt. Kitts and NevisSt. LuciaSt. Vincent and the GrenadinesSub-Saharan Africa Sub-Saharan Africa (excluding high income)Sub-Saharan Africa (IDA & IBRD countries)SudanSurinameSwazilandSwedenSwitzerlandSyrian Arab RepublicTajikistanTanzaniaThailandTimor-LesteTogoTongaTrinidad and TobagoTunisiaTurkeyTurkmenistanTurks and Caicos IslandsTuvaluUgandaUkraineUnited Arab EmiratesUnited KingdomUnited StatesUpper middle incomeUruguayUzbekistanVanuatuVenezuela, RBVietnamVirgin Islands (U.S.)WorldYemen, Rep.ZambiaZimbabwe Timeline:
This timeline shows a graph from 1971 to 2009 of Romania. No data until 1970. Number of actual observations by date: 39.
Source name:
World Development Indicators
Source organization:
World Bank staff estimates from original source: European Commission, Joint Research Centre (JRC)/Netherlands Environmental Assessment Agency (PBL). Emission Database for Global Atmospheric Research (EDGAR): http://edgar.jrc.ec.europa.eu/.
Categories, topics:
Energy & Mining, Environment
Last updated:
apr 23, 2017
Indicators value changes by year
At the date of observation
Value
Absolute change
Change from previous value
jan 1, 1971
1.717
+1.717
0.0%
jan 1, 1972
1.59
-0.127
-7.39%
jan 1, 1973
1.638
+0.047
2.98%
jan 1, 1974
1.665
+0.027
1.64%
jan 1, 1975
1.496
-0.169
-10.17%
jan 1, 1976
1.539
+0.043
2.91%
jan 1, 1977
1.659
+0.12
7.77%
jan 1, 1978
1.625
-0.034
-2.05%
jan 1, 1979
1.62
-0.004
-0.26%
jan 1, 1980
1.636
+0.016
0.98%
jan 1, 1981
1.688
+0.052
3.17%
jan 1, 1982
1.475
-0.213
-12.6%
jan 1, 1983
1.488
+0.013
0.89%
jan 1, 1984
1.557
+0.069
4.62%
jan 1, 1985
1.418
-0.14
-8.97%
jan 1, 1986
1.507
+0.089
6.29%
jan 1, 1987
1.606
+0.1
6.61%
jan 1, 1988
1.648
+0.041
2.57%
jan 1, 1989
1.906
+0.258
15.66%
jan 1, 1990
3.533
+1.627
85.39%
jan 1, 1991
3.757
+0.224
6.35%
jan 1, 1992
3.85
+0.093
2.48%
jan 1, 1993
4.409
+0.559
14.51%
jan 1, 1994
4.008
-0.4
-9.08%
jan 1, 1995
3.886
-0.122
-3.05%
jan 1, 1996
3.866
-0.02
-0.51%
jan 1, 1997
4.184
+0.317
8.21%
jan 1, 1998
5.123
+0.939
22.45%
jan 1, 1999
5.284
+0.16
3.13%
jan 1, 2000
4.29
-0.994
-18.81%
jan 1, 2001
4.886
+0.596
13.89%
jan 1, 2002
4.579
-0.307
-6.28%
jan 1, 2003
5.154
+0.575
12.56%
jan 1, 2004
5.146
-0.008
-0.15%
jan 1, 2005
4.809
-0.337
-6.55%
jan 1, 2006
4.428
-0.381
-7.92%
jan 1, 2007
5.111
+0.683
15.42%
jan 1, 2008
5.424
+0.313
6.12%
jan 1, 2009
5.406
-0.018
-0.33%
Ranking of countries by current statistics by years


Comments: