29
/
en
AIzaSyAYiBZKx7MnpbEhh9jyipgxe19OcubqV5w
April 1, 2024
134433
France
FRA
true
2
1
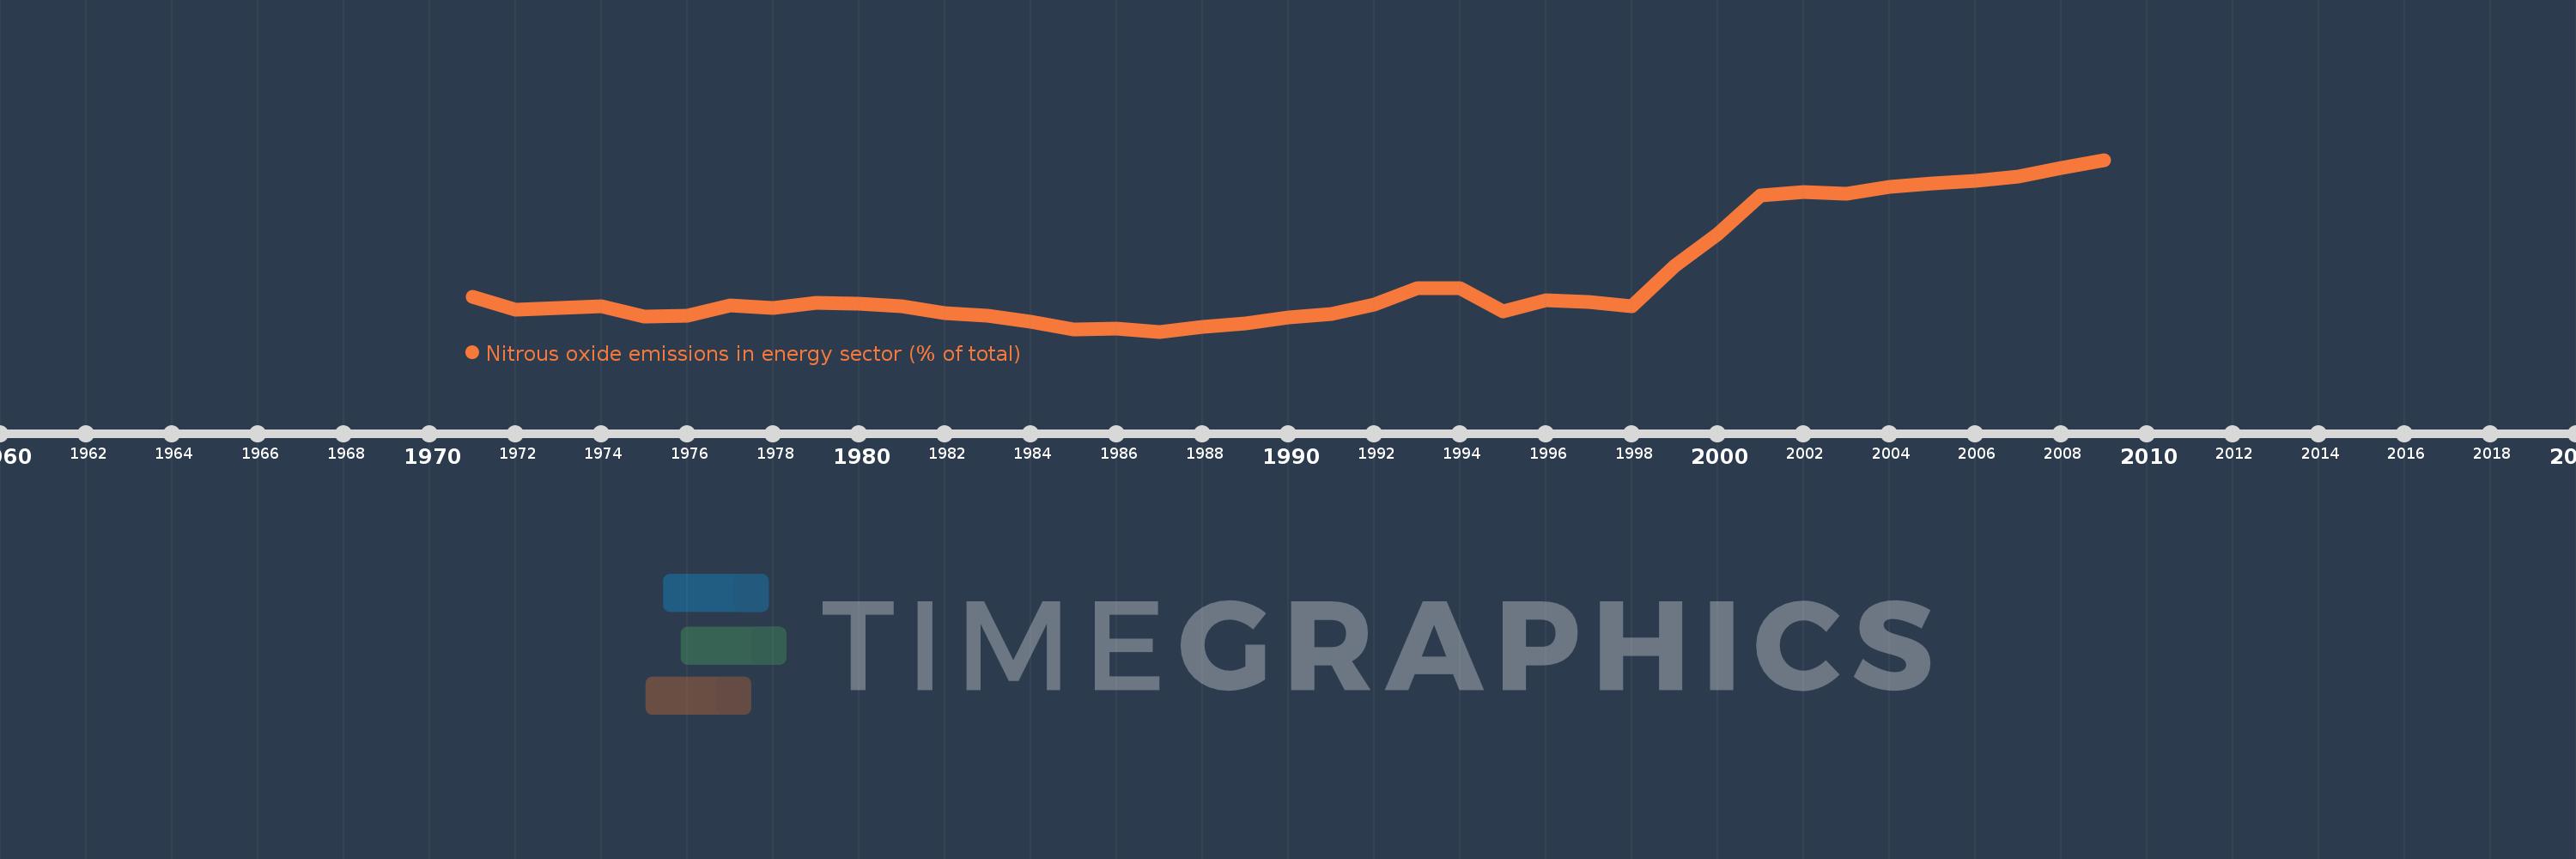
Nitrous oxide emissions in energy sector (% of total)
2009,2008,2007,2006,2005,2004,2003,2002,2001,2000,1999,1998,1997,1996,1995,1994,1993,1992,1991,1990,1989,1988,1987,1986,1985,1984,1983,1982,1981,1980,1979,1978,1977,1976,1975,1974,1973,1972,1971
This statistics in other country:
AfghanistanAlbaniaAlgeriaAmerican SamoaAndorraAngolaAntigua and BarbudaArab WorldArgentinaArmeniaArubaAustraliaAustriaAzerbaijanBahamas, TheBahrainBangladeshBarbadosBelarusBelgiumBelizeBeninBermudaBhutanBoliviaBosnia and HerzegovinaBotswanaBrazilBritish Virgin IslandsBrunei DarussalamBulgariaBurkina FasoBurundiCabo VerdeCambodiaCameroonCanadaCaribbean small statesCayman IslandsCentral African RepublicCentral Europe and the BalticsChadChileChinaColombiaComorosCongo, Dem. Rep.Congo, Rep.Costa RicaCote d'IvoireCroatiaCubaCyprusCzech RepublicDenmarkDjiboutiDominicaDominican RepublicEarly-demographic dividendEast Asia & PacificEast Asia & Pacific (excluding high income)East Asia & Pacific (IDA & IBRD countries)EcuadorEgypt, Arab Rep.El SalvadorEquatorial GuineaEritreaEstoniaEthiopiaEuro areaEurope & Central AsiaEurope & Central Asia (excluding high income)Europe & Central Asia (IDA & IBRD countries)European UnionFaroe IslandsFijiFinlandFragile and conflict affected situationsFranceFrench PolynesiaGabonGambia, TheGeorgiaGermanyGhanaGibraltarGreeceGreenlandGrenadaGuamGuatemalaGuineaGuinea-BissauGuyanaHaitiHeavily indebted poor countries (HIPC)High incomeHondurasHong Kong SAR, ChinaHungaryIBRD onlyIcelandIDA & IBRD totalIDA blendIDA onlyIDA totalIndiaIndonesiaIran, Islamic Rep.IraqIrelandIsraelItalyJamaicaJapanJordanKazakhstanKenyaKiribatiKorea, Dem. People’s Rep.Korea, Rep.KuwaitKyrgyz RepublicLao PDRLate-demographic dividendLatin America & Caribbean Latin America & Caribbean (excluding high income)Latin America & the Caribbean (IDA & IBRD countries)LatviaLeast developed countries: UN classificationLebanonLesothoLiberiaLibyaLithuaniaLow & middle incomeLow incomeLower middle incomeLuxembourgMacao SAR, ChinaMacedonia, FYRMadagascarMalawiMalaysiaMaldivesMaliMaltaMarshall IslandsMauritaniaMauritiusMexicoMicronesia, Fed. Sts.Middle East & North AfricaMiddle East & North Africa (excluding high income)Middle East & North Africa (IDA & IBRD countries)Middle incomeMoldovaMongoliaMoroccoMozambiqueMyanmarNamibiaNauruNepalNetherlandsNew CaledoniaNew ZealandNicaraguaNigerNigeriaNorth AmericaNorthern Mariana IslandsNorwayOECD membersOmanOther small statesPacific island small statesPakistanPalauPanamaPapua New GuineaParaguayPeruPhilippinesPolandPortugalPost-demographic dividendPre-demographic dividendPuerto RicoQatarRomaniaRussian FederationRwandaSamoaSao Tome and PrincipeSaudi ArabiaSenegalSerbiaSeychellesSierra LeoneSingaporeSlovak RepublicSloveniaSmall statesSolomon IslandsSomaliaSouth AfricaSouth AsiaSouth Asia (IDA & IBRD)SpainSri LankaSt. Kitts and NevisSt. LuciaSt. Vincent and the GrenadinesSub-Saharan Africa Sub-Saharan Africa (excluding high income)Sub-Saharan Africa (IDA & IBRD countries)SudanSurinameSwazilandSwedenSwitzerlandSyrian Arab RepublicTajikistanTanzaniaThailandTimor-LesteTogoTongaTrinidad and TobagoTunisiaTurkeyTurkmenistanTurks and Caicos IslandsTuvaluUgandaUkraineUnited Arab EmiratesUnited KingdomUnited StatesUpper middle incomeUruguayUzbekistanVanuatuVenezuela, RBVietnamVirgin Islands (U.S.)WorldYemen, Rep.ZambiaZimbabwe Timeline:
This timeline shows a graph from 1971 to 2009 of France. No data until 1970. Number of actual observations by date: 39.
Source name:
World Development Indicators
Source organization:
World Bank staff estimates from original source: European Commission, Joint Research Centre (JRC)/Netherlands Environmental Assessment Agency (PBL). Emission Database for Global Atmospheric Research (EDGAR): http://edgar.jrc.ec.europa.eu/.
Categories, topics:
Energy & Mining, Environment
Last updated:
apr 23, 2017
Indicators value changes by year
At the date of observation
Value
Absolute change
Change from previous value
jan 1, 1971
4.806
+4.806
0.0%
jan 1, 1972
4.536
-0.27
-5.62%
jan 1, 1973
4.568
+0.032
0.71%
jan 1, 1974
4.607
+0.039
0.85%
jan 1, 1975
4.395
-0.212
-4.59%
jan 1, 1976
4.408
+0.013
0.3%
jan 1, 1977
4.621
+0.212
4.82%
jan 1, 1978
4.57
-0.051
-1.09%
jan 1, 1979
4.68
+0.11
2.41%
jan 1, 1980
4.662
-0.019
-0.4%
jan 1, 1981
4.603
-0.058
-1.25%
jan 1, 1982
4.47
-0.133
-2.89%
jan 1, 1983
4.406
-0.064
-1.43%
jan 1, 1984
4.283
-0.123
-2.8%
jan 1, 1985
4.112
-0.171
-3.99%
jan 1, 1986
4.129
+0.017
0.42%
jan 1, 1987
4.072
-0.057
-1.39%
jan 1, 1988
4.168
+0.097
2.37%
jan 1, 1989
4.245
+0.077
1.84%
jan 1, 1990
4.367
+0.122
2.87%
jan 1, 1991
4.438
+0.071
1.62%
jan 1, 1992
4.64
+0.202
4.56%
jan 1, 1993
4.993
+0.353
7.61%
jan 1, 1994
4.986
-0.007
-0.14%
jan 1, 1995
4.503
-0.483
-9.69%
jan 1, 1996
4.727
+0.224
4.97%
jan 1, 1997
4.691
-0.036
-0.76%
jan 1, 1998
4.609
-0.082
-1.74%
jan 1, 1999
5.465
+0.856
18.57%
jan 1, 2000
6.133
+0.668
12.23%
jan 1, 2001
6.945
+0.812
13.24%
jan 1, 2002
7.016
+0.071
1.02%
jan 1, 2003
6.988
-0.028
-0.4%
jan 1, 2004
7.131
+0.143
2.05%
jan 1, 2005
7.195
+0.065
0.9%
jan 1, 2006
7.267
+0.072
1.0%
jan 1, 2007
7.346
+0.079
1.08%
jan 1, 2008
7.531
+0.185
2.52%
jan 1, 2009
7.703
+0.172
2.29%
Ranking of countries by current statistics by years


Comments: