29
/
en
AIzaSyAYiBZKx7MnpbEhh9jyipgxe19OcubqV5w
April 1, 2024
52910
OECD members
OED
false
2
1
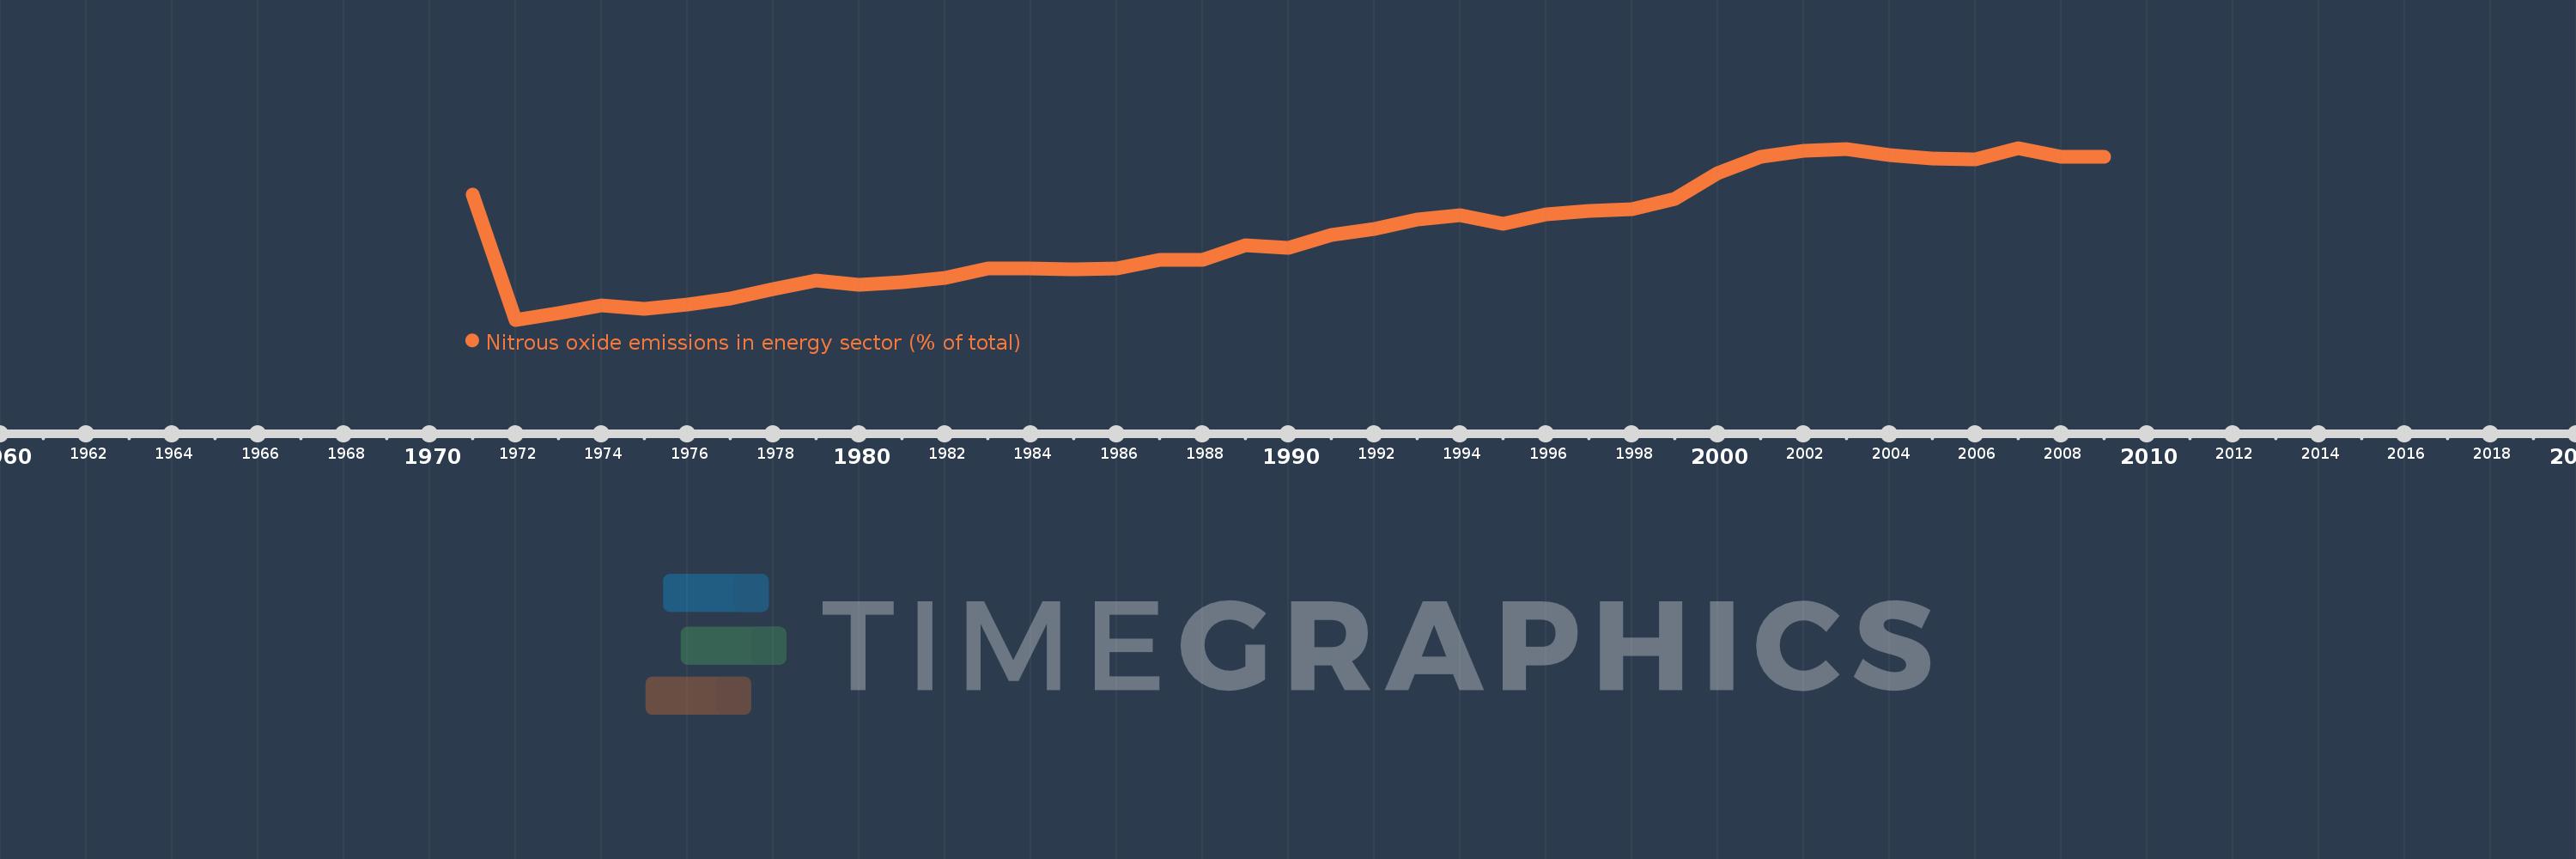
Nitrous oxide emissions in energy sector (% of total)
2009,2008,2007,2006,2005,2004,2003,2002,2001,2000,1999,1998,1997,1996,1995,1994,1993,1992,1991,1990,1989,1988,1987,1986,1985,1984,1983,1982,1981,1980,1979,1978,1977,1976,1975,1974,1973,1972,1971
This statistics in other country:
AfghanistanAlbaniaAlgeriaAmerican SamoaAndorraAngolaAntigua and BarbudaArab WorldArgentinaArmeniaArubaAustraliaAustriaAzerbaijanBahamas, TheBahrainBangladeshBarbadosBelarusBelgiumBelizeBeninBermudaBhutanBoliviaBosnia and HerzegovinaBotswanaBrazilBritish Virgin IslandsBrunei DarussalamBulgariaBurkina FasoBurundiCabo VerdeCambodiaCameroonCanadaCaribbean small statesCayman IslandsCentral African RepublicCentral Europe and the BalticsChadChileChinaColombiaComorosCongo, Dem. Rep.Congo, Rep.Costa RicaCote d'IvoireCroatiaCubaCyprusCzech RepublicDenmarkDjiboutiDominicaDominican RepublicEarly-demographic dividendEast Asia & PacificEast Asia & Pacific (excluding high income)East Asia & Pacific (IDA & IBRD countries)EcuadorEgypt, Arab Rep.El SalvadorEquatorial GuineaEritreaEstoniaEthiopiaEuro areaEurope & Central AsiaEurope & Central Asia (excluding high income)Europe & Central Asia (IDA & IBRD countries)European UnionFaroe IslandsFijiFinlandFragile and conflict affected situationsFranceFrench PolynesiaGabonGambia, TheGeorgiaGermanyGhanaGibraltarGreeceGreenlandGrenadaGuamGuatemalaGuineaGuinea-BissauGuyanaHaitiHeavily indebted poor countries (HIPC)High incomeHondurasHong Kong SAR, ChinaHungaryIBRD onlyIcelandIDA & IBRD totalIDA blendIDA onlyIDA totalIndiaIndonesiaIran, Islamic Rep.IraqIrelandIsraelItalyJamaicaJapanJordanKazakhstanKenyaKiribatiKorea, Dem. People’s Rep.Korea, Rep.KuwaitKyrgyz RepublicLao PDRLate-demographic dividendLatin America & Caribbean Latin America & Caribbean (excluding high income)Latin America & the Caribbean (IDA & IBRD countries)LatviaLeast developed countries: UN classificationLebanonLesothoLiberiaLibyaLithuaniaLow & middle incomeLow incomeLower middle incomeLuxembourgMacao SAR, ChinaMacedonia, FYRMadagascarMalawiMalaysiaMaldivesMaliMaltaMarshall IslandsMauritaniaMauritiusMexicoMicronesia, Fed. Sts.Middle East & North AfricaMiddle East & North Africa (excluding high income)Middle East & North Africa (IDA & IBRD countries)Middle incomeMoldovaMongoliaMoroccoMozambiqueMyanmarNamibiaNauruNepalNetherlandsNew CaledoniaNew ZealandNicaraguaNigerNigeriaNorth AmericaNorthern Mariana IslandsNorwayOECD membersOmanOther small statesPacific island small statesPakistanPalauPanamaPapua New GuineaParaguayPeruPhilippinesPolandPortugalPost-demographic dividendPre-demographic dividendPuerto RicoQatarRomaniaRussian FederationRwandaSamoaSao Tome and PrincipeSaudi ArabiaSenegalSerbiaSeychellesSierra LeoneSingaporeSlovak RepublicSloveniaSmall statesSolomon IslandsSomaliaSouth AfricaSouth AsiaSouth Asia (IDA & IBRD)SpainSri LankaSt. Kitts and NevisSt. LuciaSt. Vincent and the GrenadinesSub-Saharan Africa Sub-Saharan Africa (excluding high income)Sub-Saharan Africa (IDA & IBRD countries)SudanSurinameSwazilandSwedenSwitzerlandSyrian Arab RepublicTajikistanTanzaniaThailandTimor-LesteTogoTongaTrinidad and TobagoTunisiaTurkeyTurkmenistanTurks and Caicos IslandsTuvaluUgandaUkraineUnited Arab EmiratesUnited KingdomUnited StatesUpper middle incomeUruguayUzbekistanVanuatuVenezuela, RBVietnamVirgin Islands (U.S.)WorldYemen, Rep.ZambiaZimbabwe Timeline:
This timeline shows a graph from 1971 to 2009 of OECD members. No data until 1970. Number of actual observations by date: 39.
Source name:
World Development Indicators
Source organization:
World Bank staff estimates from original source: European Commission, Joint Research Centre (JRC)/Netherlands Environmental Assessment Agency (PBL). Emission Database for Global Atmospheric Research (EDGAR): http://edgar.jrc.ec.europa.eu/.
Categories, topics:
Energy & Mining, Environment
Last updated:
apr 23, 2017
Indicators value changes by year
Maximum:
15.989
jan 1, 2007
At the date of observation
Value
Absolute change
Change from previous value
jan 1, 1971
13.819
+13.819
0.0%
jan 1, 1972
7.988
-5.831
-42.2%
jan 1, 1973
8.312
+0.324
4.06%
jan 1, 1974
8.653
+0.341
4.1%
jan 1, 1975
8.51
-0.143
-1.65%
jan 1, 1976
8.684
+0.174
2.05%
jan 1, 1977
8.958
+0.274
3.15%
jan 1, 1978
9.397
+0.439
4.9%
jan 1, 1979
9.829
+0.432
4.6%
jan 1, 1980
9.632
-0.197
-2.0%
jan 1, 1981
9.73
+0.098
1.02%
jan 1, 1982
9.919
+0.189
1.94%
jan 1, 1983
10.36
+0.441
4.44%
jan 1, 1984
10.388
+0.027
0.26%
jan 1, 1985
10.336
-0.052
-0.5%
jan 1, 1986
10.375
+0.039
0.38%
jan 1, 1987
10.771
+0.395
3.81%
jan 1, 1988
10.794
+0.023
0.21%
jan 1, 1989
11.457
+0.664
6.15%
jan 1, 1990
11.332
-0.125
-1.09%
jan 1, 1991
11.948
+0.616
5.44%
jan 1, 1992
12.207
+0.259
2.17%
jan 1, 1993
12.639
+0.431
3.53%
jan 1, 1994
12.856
+0.217
1.72%
jan 1, 1995
12.472
-0.384
-2.99%
jan 1, 1996
12.909
+0.437
3.51%
jan 1, 1997
13.047
+0.138
1.07%
jan 1, 1998
13.152
+0.106
0.81%
jan 1, 1999
13.601
+0.449
3.41%
jan 1, 2000
14.798
+1.197
8.8%
jan 1, 2001
15.591
+0.794
5.36%
jan 1, 2002
15.876
+0.285
1.83%
jan 1, 2003
15.944
+0.068
0.43%
jan 1, 2004
15.641
-0.304
-1.9%
jan 1, 2005
15.477
-0.163
-1.04%
jan 1, 2006
15.475
-0.002
-0.02%
jan 1, 2007
15.989
+0.514
3.32%
jan 1, 2008
15.582
-0.407
-2.54%
jan 1, 2009
15.559
-0.024
-0.15%
Ranking of countries by current statistics by years


Comments: