29
/
en
AIzaSyAYiBZKx7MnpbEhh9jyipgxe19OcubqV5w
April 1, 2024
25999
Central Europe and the Baltics
CEB
false
2
1
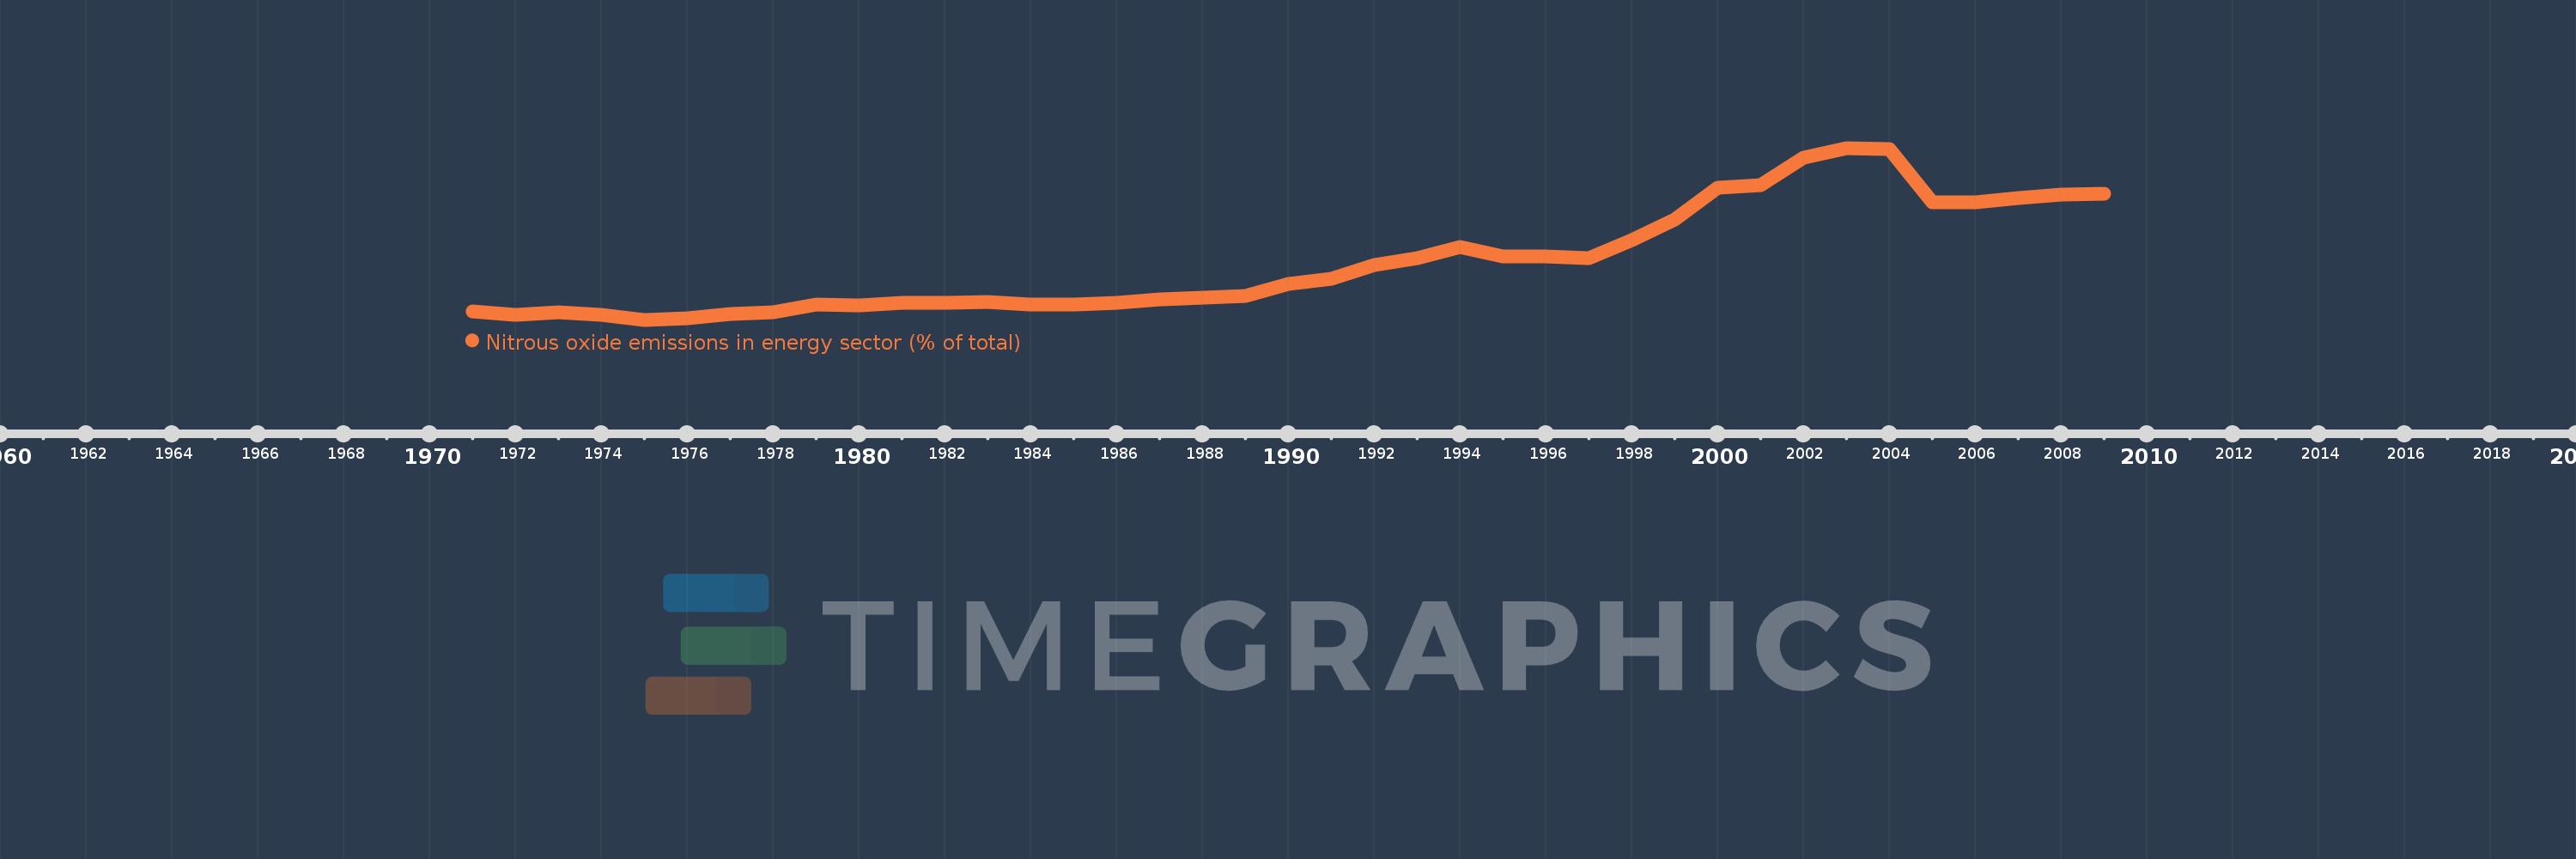
Nitrous oxide emissions in energy sector (% of total)
2009,2008,2007,2006,2005,2004,2003,2002,2001,2000,1999,1998,1997,1996,1995,1994,1993,1992,1991,1990,1989,1988,1987,1986,1985,1984,1983,1982,1981,1980,1979,1978,1977,1976,1975,1974,1973,1972,1971
This statistics in other country:
AfghanistanAlbaniaAlgeriaAmerican SamoaAndorraAngolaAntigua and BarbudaArab WorldArgentinaArmeniaArubaAustraliaAustriaAzerbaijanBahamas, TheBahrainBangladeshBarbadosBelarusBelgiumBelizeBeninBermudaBhutanBoliviaBosnia and HerzegovinaBotswanaBrazilBritish Virgin IslandsBrunei DarussalamBulgariaBurkina FasoBurundiCabo VerdeCambodiaCameroonCanadaCaribbean small statesCayman IslandsCentral African RepublicCentral Europe and the BalticsChadChileChinaColombiaComorosCongo, Dem. Rep.Congo, Rep.Costa RicaCote d'IvoireCroatiaCubaCyprusCzech RepublicDenmarkDjiboutiDominicaDominican RepublicEarly-demographic dividendEast Asia & PacificEast Asia & Pacific (excluding high income)East Asia & Pacific (IDA & IBRD countries)EcuadorEgypt, Arab Rep.El SalvadorEquatorial GuineaEritreaEstoniaEthiopiaEuro areaEurope & Central AsiaEurope & Central Asia (excluding high income)Europe & Central Asia (IDA & IBRD countries)European UnionFaroe IslandsFijiFinlandFragile and conflict affected situationsFranceFrench PolynesiaGabonGambia, TheGeorgiaGermanyGhanaGibraltarGreeceGreenlandGrenadaGuamGuatemalaGuineaGuinea-BissauGuyanaHaitiHeavily indebted poor countries (HIPC)High incomeHondurasHong Kong SAR, ChinaHungaryIBRD onlyIcelandIDA & IBRD totalIDA blendIDA onlyIDA totalIndiaIndonesiaIran, Islamic Rep.IraqIrelandIsraelItalyJamaicaJapanJordanKazakhstanKenyaKiribatiKorea, Dem. People’s Rep.Korea, Rep.KuwaitKyrgyz RepublicLao PDRLate-demographic dividendLatin America & Caribbean Latin America & Caribbean (excluding high income)Latin America & the Caribbean (IDA & IBRD countries)LatviaLeast developed countries: UN classificationLebanonLesothoLiberiaLibyaLithuaniaLow & middle incomeLow incomeLower middle incomeLuxembourgMacao SAR, ChinaMacedonia, FYRMadagascarMalawiMalaysiaMaldivesMaliMaltaMarshall IslandsMauritaniaMauritiusMexicoMicronesia, Fed. Sts.Middle East & North AfricaMiddle East & North Africa (excluding high income)Middle East & North Africa (IDA & IBRD countries)Middle incomeMoldovaMongoliaMoroccoMozambiqueMyanmarNamibiaNauruNepalNetherlandsNew CaledoniaNew ZealandNicaraguaNigerNigeriaNorth AmericaNorthern Mariana IslandsNorwayOECD membersOmanOther small statesPacific island small statesPakistanPalauPanamaPapua New GuineaParaguayPeruPhilippinesPolandPortugalPost-demographic dividendPre-demographic dividendPuerto RicoQatarRomaniaRussian FederationRwandaSamoaSao Tome and PrincipeSaudi ArabiaSenegalSerbiaSeychellesSierra LeoneSingaporeSlovak RepublicSloveniaSmall statesSolomon IslandsSomaliaSouth AfricaSouth AsiaSouth Asia (IDA & IBRD)SpainSri LankaSt. Kitts and NevisSt. LuciaSt. Vincent and the GrenadinesSub-Saharan Africa Sub-Saharan Africa (excluding high income)Sub-Saharan Africa (IDA & IBRD countries)SudanSurinameSwazilandSwedenSwitzerlandSyrian Arab RepublicTajikistanTanzaniaThailandTimor-LesteTogoTongaTrinidad and TobagoTunisiaTurkeyTurkmenistanTurks and Caicos IslandsTuvaluUgandaUkraineUnited Arab EmiratesUnited KingdomUnited StatesUpper middle incomeUruguayUzbekistanVanuatuVenezuela, RBVietnamVirgin Islands (U.S.)WorldYemen, Rep.ZambiaZimbabwe Timeline:
This timeline shows a graph from 1971 to 2009 of Central Europe and the Baltics. No data until 1970. Number of actual observations by date: 39.
Source name:
World Development Indicators
Source organization:
World Bank staff estimates from original source: European Commission, Joint Research Centre (JRC)/Netherlands Environmental Assessment Agency (PBL). Emission Database for Global Atmospheric Research (EDGAR): http://edgar.jrc.ec.europa.eu/.
Categories, topics:
Energy & Mining, Environment
Last updated:
apr 23, 2017
Indicators value changes by year
Maximum:
13.569
jan 1, 2003
At the date of observation
Value
Absolute change
Change from previous value
jan 1, 1971
5.316
+5.316
0.0%
jan 1, 1972
5.128
-0.188
-3.53%
jan 1, 1973
5.267
+0.138
2.7%
jan 1, 1974
5.131
-0.136
-2.58%
jan 1, 1975
4.885
-0.245
-4.78%
jan 1, 1976
4.951
+0.066
1.35%
jan 1, 1977
5.155
+0.204
4.12%
jan 1, 1978
5.257
+0.102
1.97%
jan 1, 1979
5.646
+0.39
7.41%
jan 1, 1980
5.628
-0.019
-0.33%
jan 1, 1981
5.745
+0.118
2.09%
jan 1, 1982
5.751
+0.006
0.11%
jan 1, 1983
5.773
+0.021
0.37%
jan 1, 1984
5.665
-0.108
-1.87%
jan 1, 1985
5.655
-0.01
-0.18%
jan 1, 1986
5.738
+0.084
1.48%
jan 1, 1987
5.916
+0.178
3.1%
jan 1, 1988
6.002
+0.086
1.45%
jan 1, 1989
6.106
+0.104
1.73%
jan 1, 1990
6.693
+0.586
9.6%
jan 1, 1991
6.97
+0.277
4.15%
jan 1, 1992
7.636
+0.666
9.55%
jan 1, 1993
8.004
+0.368
4.82%
jan 1, 1994
8.577
+0.573
7.15%
jan 1, 1995
8.082
-0.495
-5.77%
jan 1, 1996
8.104
+0.022
0.27%
jan 1, 1997
8.003
-0.1
-1.24%
jan 1, 1998
8.926
+0.923
11.53%
jan 1, 1999
9.954
+1.028
11.51%
jan 1, 2000
11.577
+1.624
16.31%
jan 1, 2001
11.669
+0.091
0.79%
jan 1, 2002
13.078
+1.409
12.08%
jan 1, 2003
13.569
+0.491
3.75%
jan 1, 2004
13.492
-0.077
-0.57%
jan 1, 2005
10.836
-2.656
-19.69%
jan 1, 2006
10.84
+0.004
0.04%
jan 1, 2007
11.047
+0.207
1.91%
jan 1, 2008
11.199
+0.152
1.37%
jan 1, 2009
11.246
+0.047
0.42%
Ranking of countries by current statistics by years


Comments: