29
/
en
AIzaSyAYiBZKx7MnpbEhh9jyipgxe19OcubqV5w
April 1, 2024
215635
Oman
OMN
true
2
1
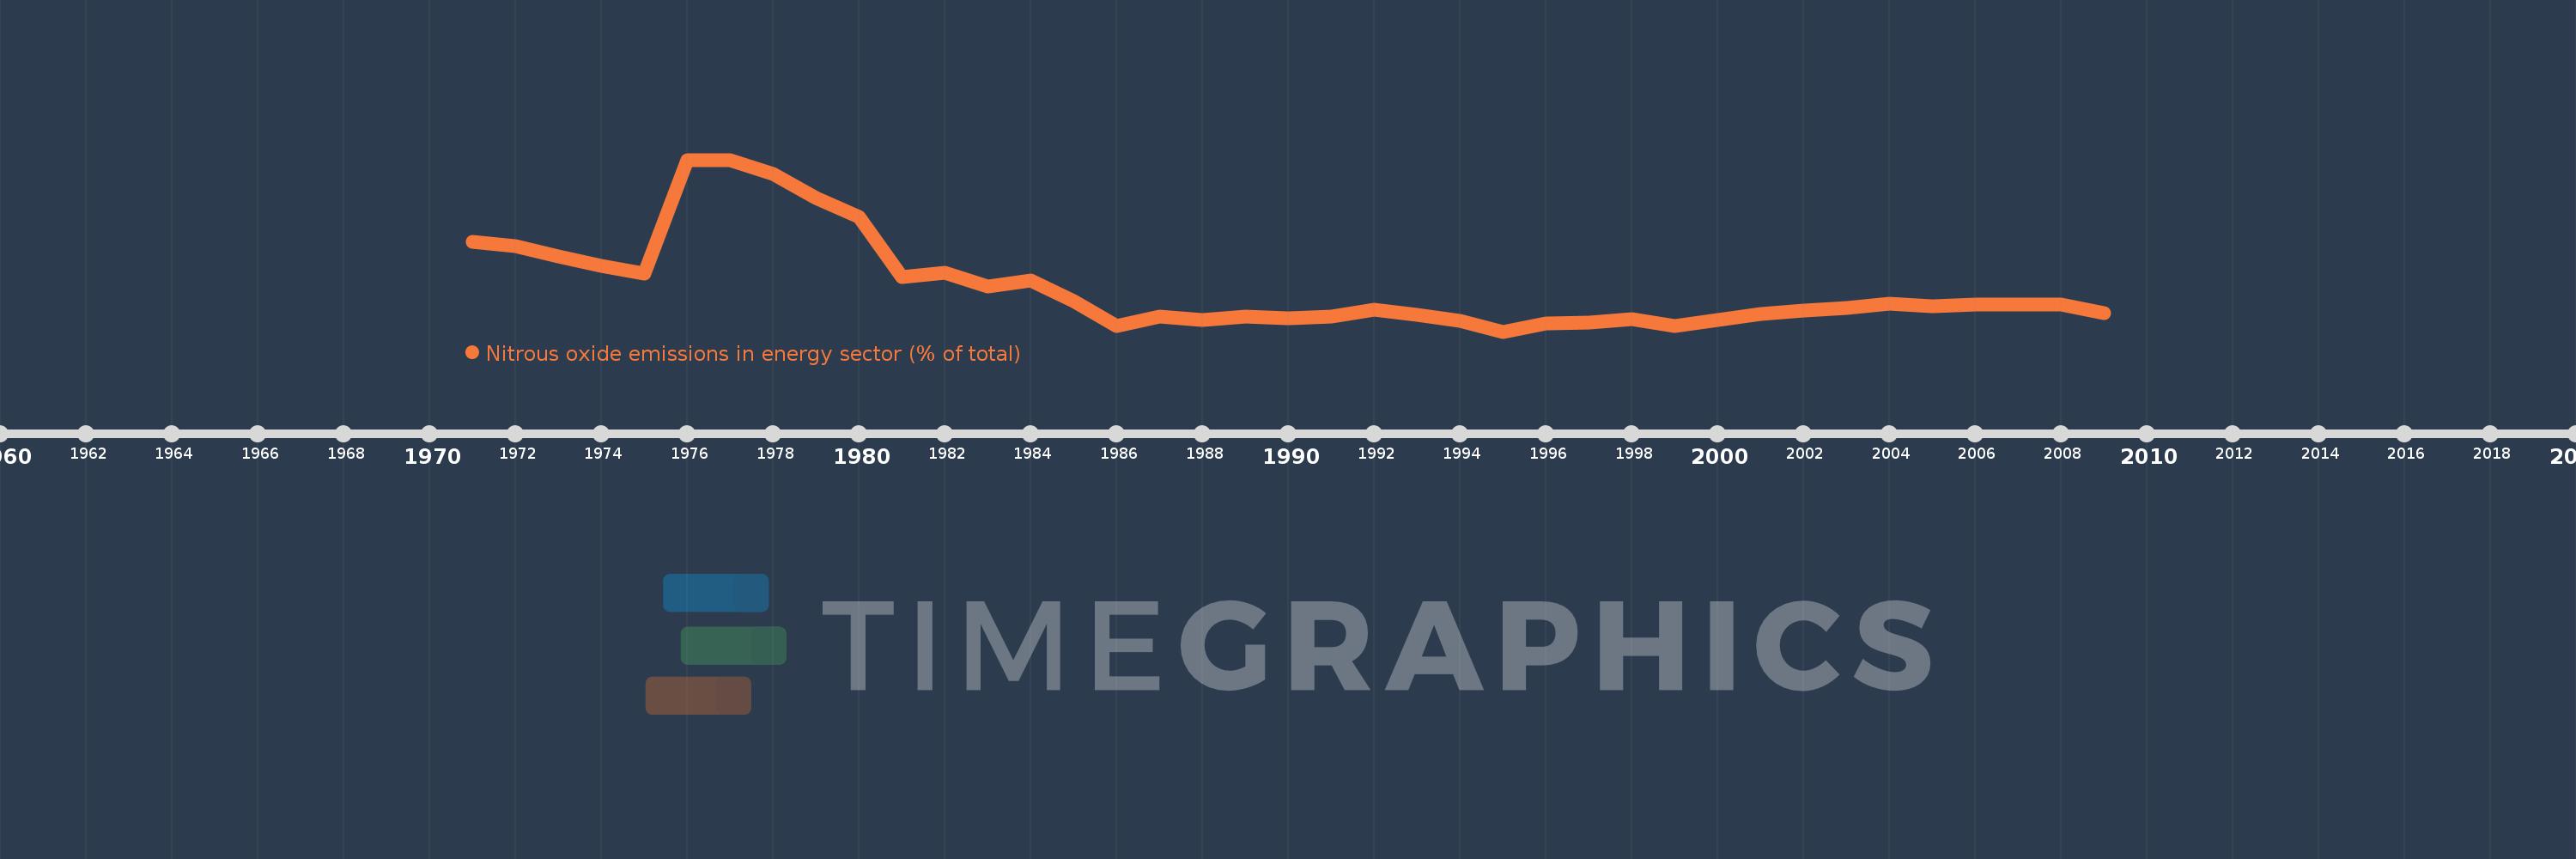
Nitrous oxide emissions in energy sector (% of total)
2009,2008,2007,2006,2005,2004,2003,2002,2001,2000,1999,1998,1997,1996,1995,1994,1993,1992,1991,1990,1989,1988,1987,1986,1985,1984,1983,1982,1981,1980,1979,1978,1977,1976,1975,1974,1973,1972,1971
This statistics in other country:
AfghanistanAlbaniaAlgeriaAmerican SamoaAndorraAngolaAntigua and BarbudaArab WorldArgentinaArmeniaArubaAustraliaAustriaAzerbaijanBahamas, TheBahrainBangladeshBarbadosBelarusBelgiumBelizeBeninBermudaBhutanBoliviaBosnia and HerzegovinaBotswanaBrazilBritish Virgin IslandsBrunei DarussalamBulgariaBurkina FasoBurundiCabo VerdeCambodiaCameroonCanadaCaribbean small statesCayman IslandsCentral African RepublicCentral Europe and the BalticsChadChileChinaColombiaComorosCongo, Dem. Rep.Congo, Rep.Costa RicaCote d'IvoireCroatiaCubaCyprusCzech RepublicDenmarkDjiboutiDominicaDominican RepublicEarly-demographic dividendEast Asia & PacificEast Asia & Pacific (excluding high income)East Asia & Pacific (IDA & IBRD countries)EcuadorEgypt, Arab Rep.El SalvadorEquatorial GuineaEritreaEstoniaEthiopiaEuro areaEurope & Central AsiaEurope & Central Asia (excluding high income)Europe & Central Asia (IDA & IBRD countries)European UnionFaroe IslandsFijiFinlandFragile and conflict affected situationsFranceFrench PolynesiaGabonGambia, TheGeorgiaGermanyGhanaGibraltarGreeceGreenlandGrenadaGuamGuatemalaGuineaGuinea-BissauGuyanaHaitiHeavily indebted poor countries (HIPC)High incomeHondurasHong Kong SAR, ChinaHungaryIBRD onlyIcelandIDA & IBRD totalIDA blendIDA onlyIDA totalIndiaIndonesiaIran, Islamic Rep.IraqIrelandIsraelItalyJamaicaJapanJordanKazakhstanKenyaKiribatiKorea, Dem. People’s Rep.Korea, Rep.KuwaitKyrgyz RepublicLao PDRLate-demographic dividendLatin America & Caribbean Latin America & Caribbean (excluding high income)Latin America & the Caribbean (IDA & IBRD countries)LatviaLeast developed countries: UN classificationLebanonLesothoLiberiaLibyaLithuaniaLow & middle incomeLow incomeLower middle incomeLuxembourgMacao SAR, ChinaMacedonia, FYRMadagascarMalawiMalaysiaMaldivesMaliMaltaMarshall IslandsMauritaniaMauritiusMexicoMicronesia, Fed. Sts.Middle East & North AfricaMiddle East & North Africa (excluding high income)Middle East & North Africa (IDA & IBRD countries)Middle incomeMoldovaMongoliaMoroccoMozambiqueMyanmarNamibiaNauruNepalNetherlandsNew CaledoniaNew ZealandNicaraguaNigerNigeriaNorth AmericaNorthern Mariana IslandsNorwayOECD membersOmanOther small statesPacific island small statesPakistanPalauPanamaPapua New GuineaParaguayPeruPhilippinesPolandPortugalPost-demographic dividendPre-demographic dividendPuerto RicoQatarRomaniaRussian FederationRwandaSamoaSao Tome and PrincipeSaudi ArabiaSenegalSerbiaSeychellesSierra LeoneSingaporeSlovak RepublicSloveniaSmall statesSolomon IslandsSomaliaSouth AfricaSouth AsiaSouth Asia (IDA & IBRD)SpainSri LankaSt. Kitts and NevisSt. LuciaSt. Vincent and the GrenadinesSub-Saharan Africa Sub-Saharan Africa (excluding high income)Sub-Saharan Africa (IDA & IBRD countries)SudanSurinameSwazilandSwedenSwitzerlandSyrian Arab RepublicTajikistanTanzaniaThailandTimor-LesteTogoTongaTrinidad and TobagoTunisiaTurkeyTurkmenistanTurks and Caicos IslandsTuvaluUgandaUkraineUnited Arab EmiratesUnited KingdomUnited StatesUpper middle incomeUruguayUzbekistanVanuatuVenezuela, RBVietnamVirgin Islands (U.S.)WorldYemen, Rep.ZambiaZimbabwe Timeline:
This timeline shows a graph from 1971 to 2009 of Oman. No data until 1970. Number of actual observations by date: 39.
Source name:
World Development Indicators
Source organization:
World Bank staff estimates from original source: European Commission, Joint Research Centre (JRC)/Netherlands Environmental Assessment Agency (PBL). Emission Database for Global Atmospheric Research (EDGAR): http://edgar.jrc.ec.europa.eu/.
Categories, topics:
Energy & Mining, Environment
Last updated:
apr 23, 2017
Indicators value changes by year
Minimum:
10.148
jan 1, 1995
Maximum:
39.206
jan 1, 1976
At the date of observation
Value
Absolute change
Change from previous value
jan 1, 1971
25.381
+25.381
0.0%
jan 1, 1972
24.579
-0.802
-3.16%
jan 1, 1973
22.902
-1.677
-6.82%
jan 1, 1974
21.289
-1.613
-7.04%
jan 1, 1975
19.905
-1.384
-6.5%
jan 1, 1976
39.206
+19.301
96.97%
jan 1, 1977
39.072
-0.133
-0.34%
jan 1, 1978
36.833
-2.24
-5.73%
jan 1, 1979
32.754
-4.078
-11.07%
jan 1, 1980
29.609
-3.146
-9.6%
jan 1, 1981
19.408
-10.2
-34.45%
jan 1, 1982
20.038
+0.63
3.24%
jan 1, 1983
17.753
-2.285
-11.4%
jan 1, 1984
18.738
+0.985
5.55%
jan 1, 1985
15.312
-3.426
-18.28%
jan 1, 1986
11.101
-4.212
-27.51%
jan 1, 1987
12.731
+1.631
14.69%
jan 1, 1988
12.098
-0.633
-4.97%
jan 1, 1989
12.683
+0.586
4.84%
jan 1, 1990
12.354
-0.33
-2.6%
jan 1, 1991
12.715
+0.361
2.92%
jan 1, 1992
13.874
+1.159
9.12%
jan 1, 1993
13.012
-0.862
-6.21%
jan 1, 1994
11.974
-1.038
-7.98%
jan 1, 1995
10.148
-1.826
-15.25%
jan 1, 1996
11.483
+1.335
13.16%
jan 1, 1997
11.742
+0.259
2.26%
jan 1, 1998
12.308
+0.565
4.81%
jan 1, 1999
11.114
-1.193
-9.7%
jan 1, 2000
12.087
+0.972
8.75%
jan 1, 2001
13.153
+1.066
8.82%
jan 1, 2002
13.709
+0.556
4.23%
jan 1, 2003
14.082
+0.373
2.72%
jan 1, 2004
14.799
+0.718
5.1%
jan 1, 2005
14.492
-0.308
-2.08%
jan 1, 2006
14.768
+0.276
1.91%
jan 1, 2007
14.697
-0.071
-0.48%
jan 1, 2008
14.764
+0.067
0.46%
jan 1, 2009
13.281
-1.484
-10.05%
Ranking of countries by current statistics by years


Comments: