29
/
en
AIzaSyAYiBZKx7MnpbEhh9jyipgxe19OcubqV5w
April 1, 2024
207177
Nepal
NPL
true
2
1
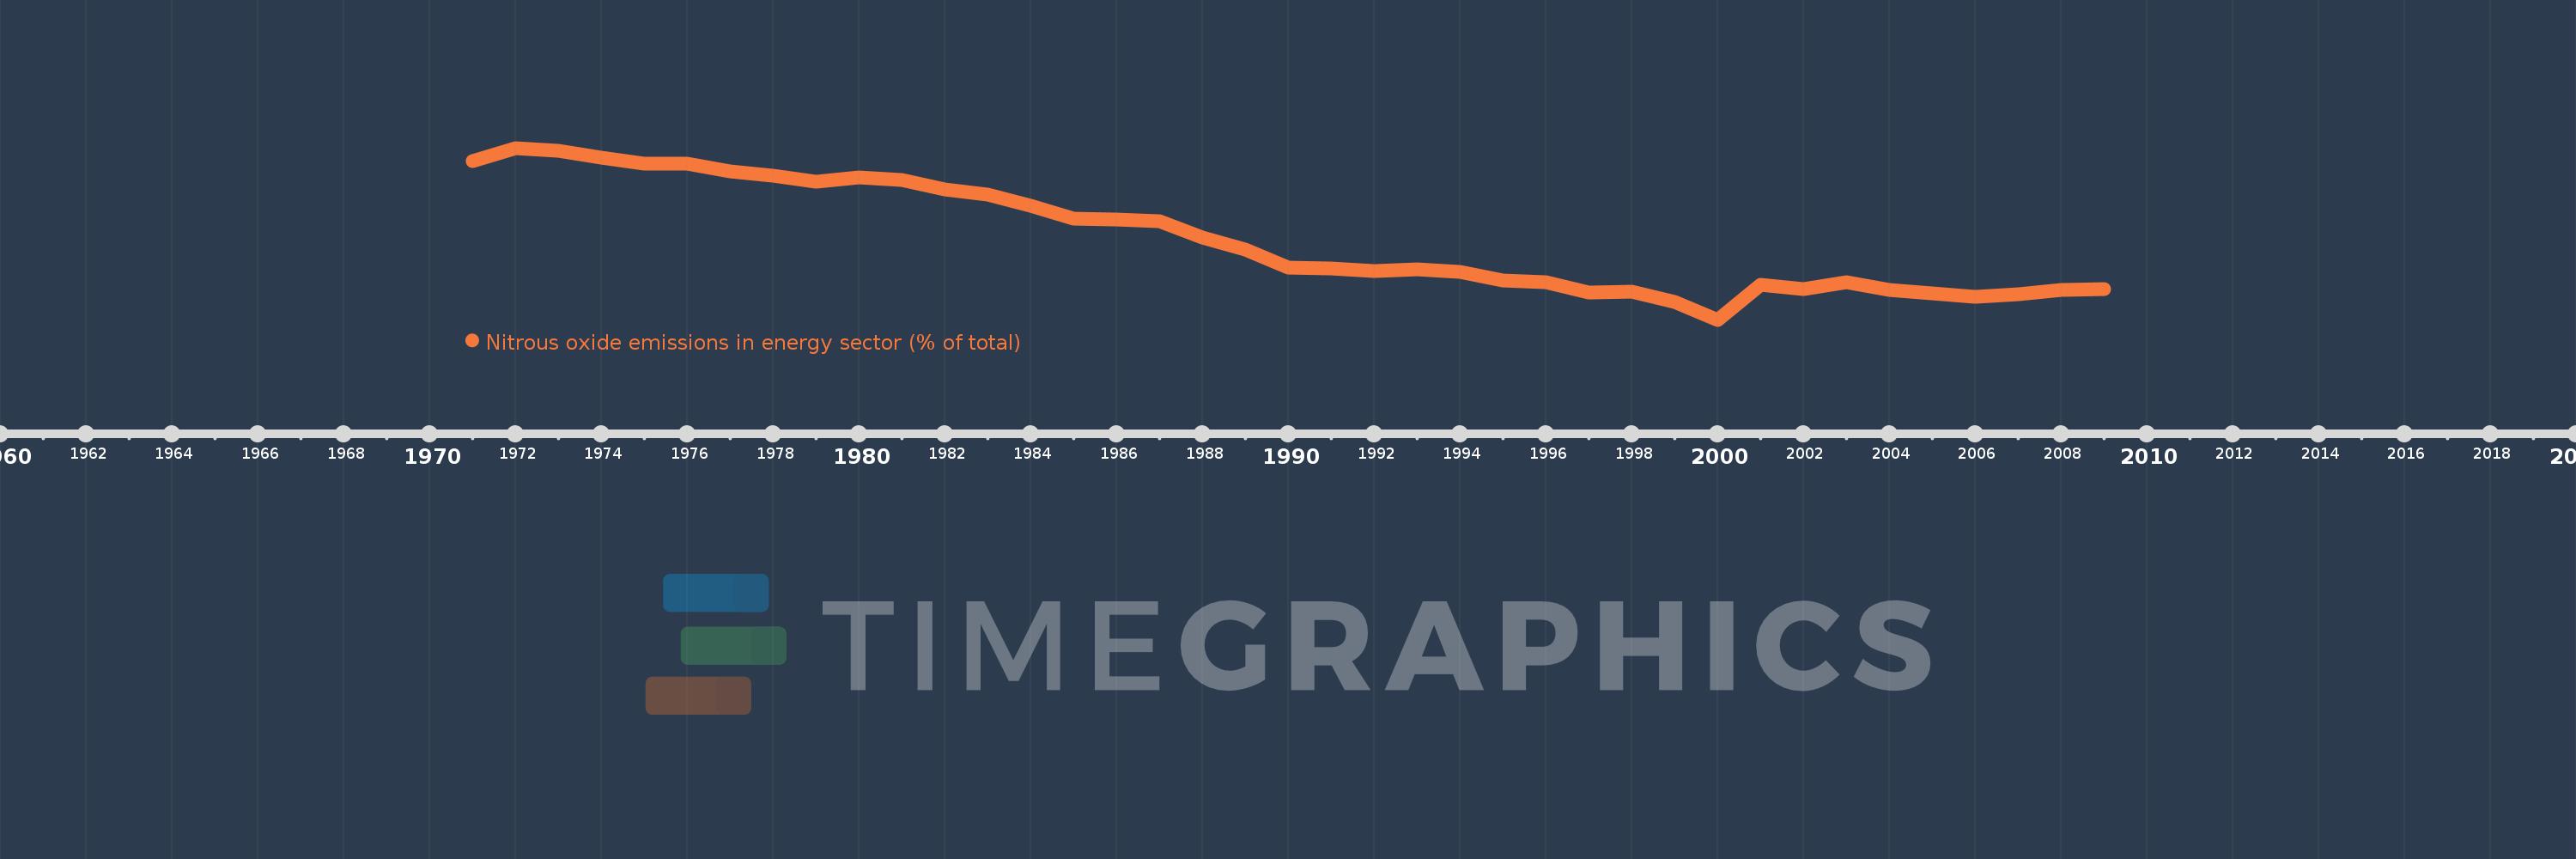
Nitrous oxide emissions in energy sector (% of total)
2009,2008,2007,2006,2005,2004,2003,2002,2001,2000,1999,1998,1997,1996,1995,1994,1993,1992,1991,1990,1989,1988,1987,1986,1985,1984,1983,1982,1981,1980,1979,1978,1977,1976,1975,1974,1973,1972,1971
This statistics in other country:
AfghanistanAlbaniaAlgeriaAmerican SamoaAndorraAngolaAntigua and BarbudaArab WorldArgentinaArmeniaArubaAustraliaAustriaAzerbaijanBahamas, TheBahrainBangladeshBarbadosBelarusBelgiumBelizeBeninBermudaBhutanBoliviaBosnia and HerzegovinaBotswanaBrazilBritish Virgin IslandsBrunei DarussalamBulgariaBurkina FasoBurundiCabo VerdeCambodiaCameroonCanadaCaribbean small statesCayman IslandsCentral African RepublicCentral Europe and the BalticsChadChileChinaColombiaComorosCongo, Dem. Rep.Congo, Rep.Costa RicaCote d'IvoireCroatiaCubaCyprusCzech RepublicDenmarkDjiboutiDominicaDominican RepublicEarly-demographic dividendEast Asia & PacificEast Asia & Pacific (excluding high income)East Asia & Pacific (IDA & IBRD countries)EcuadorEgypt, Arab Rep.El SalvadorEquatorial GuineaEritreaEstoniaEthiopiaEuro areaEurope & Central AsiaEurope & Central Asia (excluding high income)Europe & Central Asia (IDA & IBRD countries)European UnionFaroe IslandsFijiFinlandFragile and conflict affected situationsFranceFrench PolynesiaGabonGambia, TheGeorgiaGermanyGhanaGibraltarGreeceGreenlandGrenadaGuamGuatemalaGuineaGuinea-BissauGuyanaHaitiHeavily indebted poor countries (HIPC)High incomeHondurasHong Kong SAR, ChinaHungaryIBRD onlyIcelandIDA & IBRD totalIDA blendIDA onlyIDA totalIndiaIndonesiaIran, Islamic Rep.IraqIrelandIsraelItalyJamaicaJapanJordanKazakhstanKenyaKiribatiKorea, Dem. People’s Rep.Korea, Rep.KuwaitKyrgyz RepublicLao PDRLate-demographic dividendLatin America & Caribbean Latin America & Caribbean (excluding high income)Latin America & the Caribbean (IDA & IBRD countries)LatviaLeast developed countries: UN classificationLebanonLesothoLiberiaLibyaLithuaniaLow & middle incomeLow incomeLower middle incomeLuxembourgMacao SAR, ChinaMacedonia, FYRMadagascarMalawiMalaysiaMaldivesMaliMaltaMarshall IslandsMauritaniaMauritiusMexicoMicronesia, Fed. Sts.Middle East & North AfricaMiddle East & North Africa (excluding high income)Middle East & North Africa (IDA & IBRD countries)Middle incomeMoldovaMongoliaMoroccoMozambiqueMyanmarNamibiaNauruNepalNetherlandsNew CaledoniaNew ZealandNicaraguaNigerNigeriaNorth AmericaNorthern Mariana IslandsNorwayOECD membersOmanOther small statesPacific island small statesPakistanPalauPanamaPapua New GuineaParaguayPeruPhilippinesPolandPortugalPost-demographic dividendPre-demographic dividendPuerto RicoQatarRomaniaRussian FederationRwandaSamoaSao Tome and PrincipeSaudi ArabiaSenegalSerbiaSeychellesSierra LeoneSingaporeSlovak RepublicSloveniaSmall statesSolomon IslandsSomaliaSouth AfricaSouth AsiaSouth Asia (IDA & IBRD)SpainSri LankaSt. Kitts and NevisSt. LuciaSt. Vincent and the GrenadinesSub-Saharan Africa Sub-Saharan Africa (excluding high income)Sub-Saharan Africa (IDA & IBRD countries)SudanSurinameSwazilandSwedenSwitzerlandSyrian Arab RepublicTajikistanTanzaniaThailandTimor-LesteTogoTongaTrinidad and TobagoTunisiaTurkeyTurkmenistanTurks and Caicos IslandsTuvaluUgandaUkraineUnited Arab EmiratesUnited KingdomUnited StatesUpper middle incomeUruguayUzbekistanVanuatuVenezuela, RBVietnamVirgin Islands (U.S.)WorldYemen, Rep.ZambiaZimbabwe Timeline:
This timeline shows a graph from 1971 to 2009 of Nepal. No data until 1970. Number of actual observations by date: 39.
Source name:
World Development Indicators
Source organization:
World Bank staff estimates from original source: European Commission, Joint Research Centre (JRC)/Netherlands Environmental Assessment Agency (PBL). Emission Database for Global Atmospheric Research (EDGAR): http://edgar.jrc.ec.europa.eu/.
Categories, topics:
Energy & Mining, Environment
Last updated:
apr 23, 2017
Indicators value changes by year
Minimum:
12.612
jan 1, 2000
Maximum:
16.266
jan 1, 1972
At the date of observation
Value
Absolute change
Change from previous value
jan 1, 1971
15.987
+15.987
0.0%
jan 1, 1972
16.266
+0.279
1.74%
jan 1, 1973
16.201
-0.064
-0.4%
jan 1, 1974
16.062
-0.139
-0.86%
jan 1, 1975
15.937
-0.125
-0.78%
jan 1, 1976
15.936
-0.001
0.0%
jan 1, 1977
15.769
-0.167
-1.05%
jan 1, 1978
15.68
-0.089
-0.57%
jan 1, 1979
15.557
-0.123
-0.78%
jan 1, 1980
15.64
+0.082
0.53%
jan 1, 1981
15.585
-0.054
-0.35%
jan 1, 1982
15.38
-0.206
-1.32%
jan 1, 1983
15.277
-0.103
-0.67%
jan 1, 1984
15.031
-0.246
-1.61%
jan 1, 1985
14.765
-0.266
-1.77%
jan 1, 1986
14.741
-0.024
-0.16%
jan 1, 1987
14.706
-0.034
-0.23%
jan 1, 1988
14.357
-0.349
-2.37%
jan 1, 1989
14.106
-0.251
-1.75%
jan 1, 1990
13.716
-0.39
-2.77%
jan 1, 1991
13.71
-0.006
-0.05%
jan 1, 1992
13.647
-0.062
-0.45%
jan 1, 1993
13.691
+0.043
0.32%
jan 1, 1994
13.636
-0.055
-0.4%
jan 1, 1995
13.452
-0.184
-1.35%
jan 1, 1996
13.418
-0.034
-0.25%
jan 1, 1997
13.193
-0.225
-1.67%
jan 1, 1998
13.204
+0.011
0.08%
jan 1, 1999
12.997
-0.207
-1.57%
jan 1, 2000
12.612
-0.385
-2.96%
jan 1, 2001
13.358
+0.746
5.92%
jan 1, 2002
13.256
-0.102
-0.77%
jan 1, 2003
13.405
+0.148
1.12%
jan 1, 2004
13.247
-0.158
-1.18%
jan 1, 2005
13.164
-0.082
-0.62%
jan 1, 2006
13.104
-0.06
-0.46%
jan 1, 2007
13.15
+0.045
0.35%
jan 1, 2008
13.243
+0.093
0.71%
jan 1, 2009
13.273
+0.031
0.23%
Ranking of countries by current statistics by years


Comments: