29
/
en
AIzaSyAYiBZKx7MnpbEhh9jyipgxe19OcubqV5w
April 1, 2024
282708
Vietnam
VNM
true
2
1
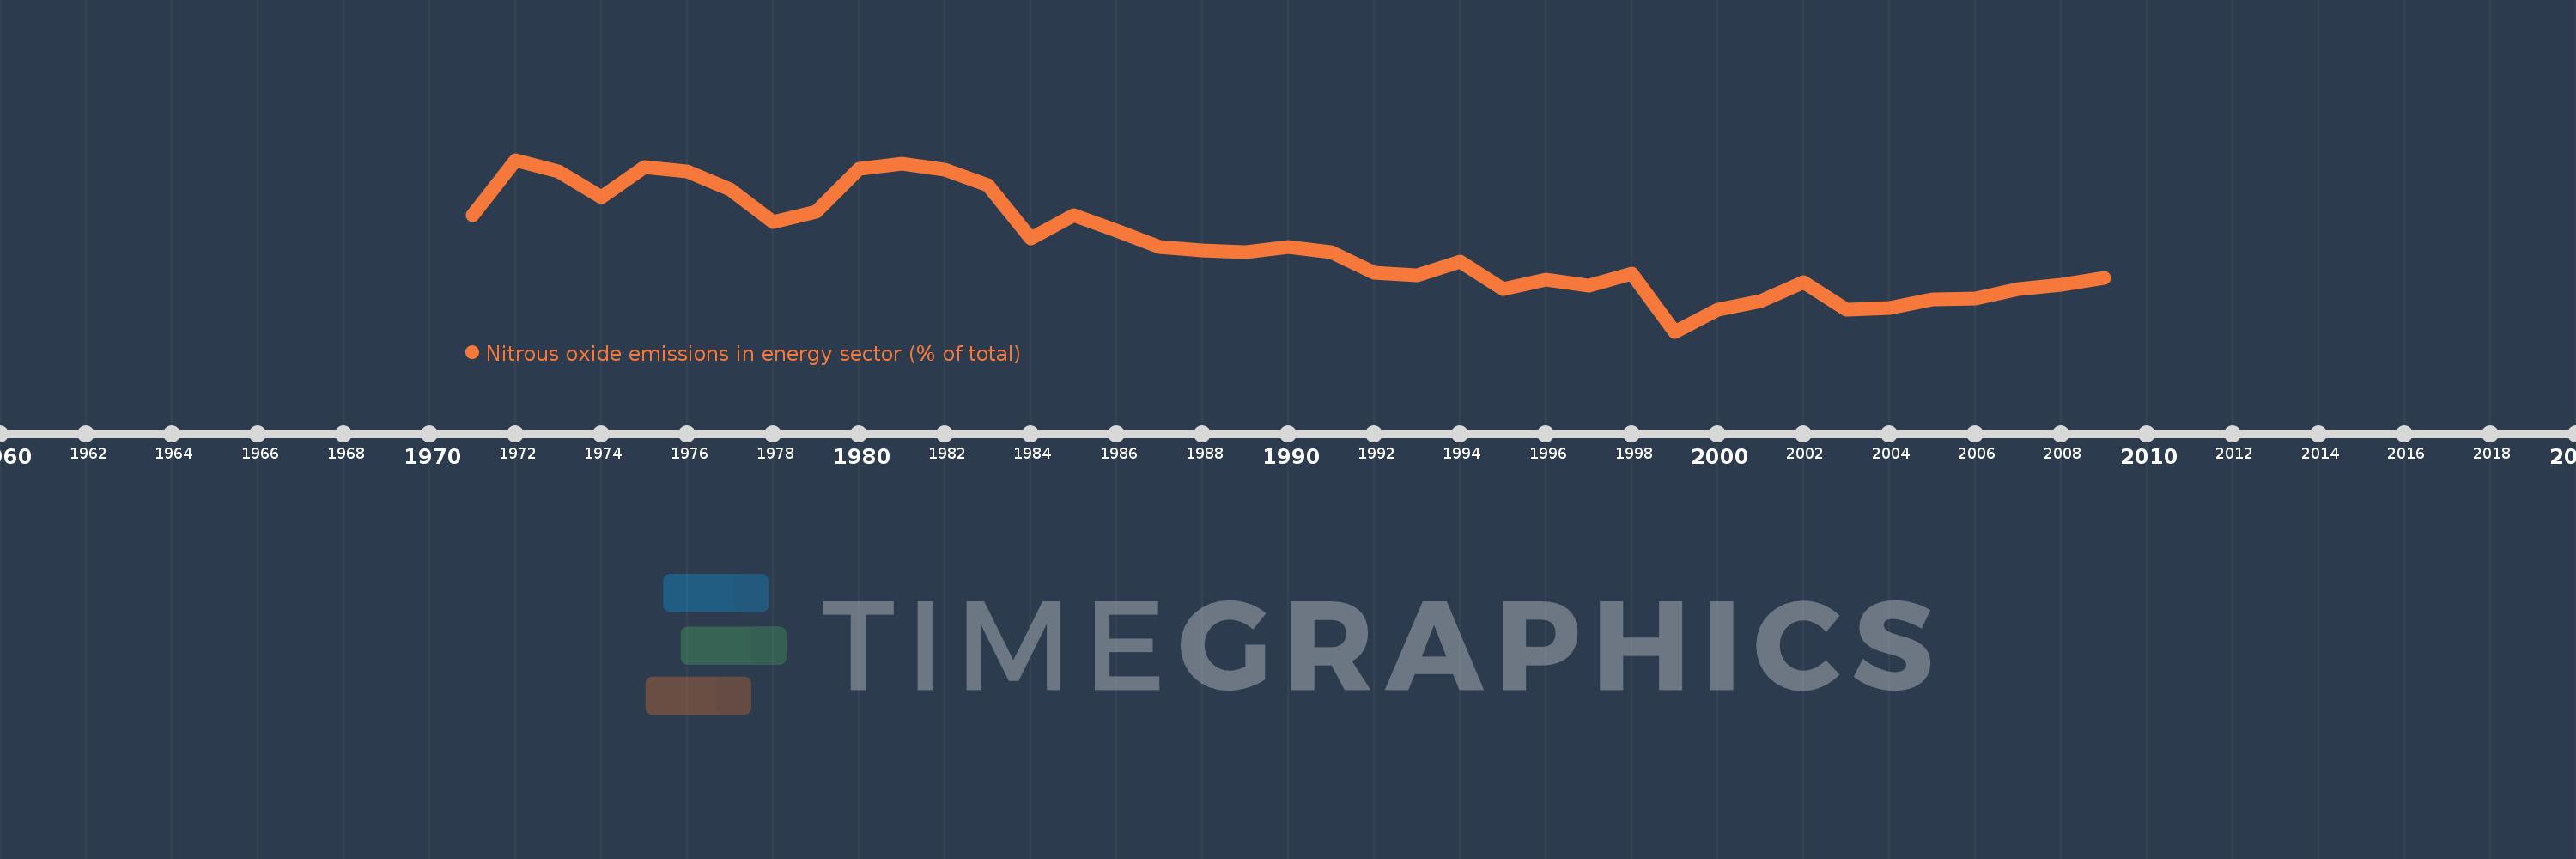
Nitrous oxide emissions in energy sector (% of total)
2009,2008,2007,2006,2005,2004,2003,2002,2001,2000,1999,1998,1997,1996,1995,1994,1993,1992,1991,1990,1989,1988,1987,1986,1985,1984,1983,1982,1981,1980,1979,1978,1977,1976,1975,1974,1973,1972,1971
This statistics in other country:
AfghanistanAlbaniaAlgeriaAmerican SamoaAndorraAngolaAntigua and BarbudaArab WorldArgentinaArmeniaArubaAustraliaAustriaAzerbaijanBahamas, TheBahrainBangladeshBarbadosBelarusBelgiumBelizeBeninBermudaBhutanBoliviaBosnia and HerzegovinaBotswanaBrazilBritish Virgin IslandsBrunei DarussalamBulgariaBurkina FasoBurundiCabo VerdeCambodiaCameroonCanadaCaribbean small statesCayman IslandsCentral African RepublicCentral Europe and the BalticsChadChileChinaColombiaComorosCongo, Dem. Rep.Congo, Rep.Costa RicaCote d'IvoireCroatiaCubaCyprusCzech RepublicDenmarkDjiboutiDominicaDominican RepublicEarly-demographic dividendEast Asia & PacificEast Asia & Pacific (excluding high income)East Asia & Pacific (IDA & IBRD countries)EcuadorEgypt, Arab Rep.El SalvadorEquatorial GuineaEritreaEstoniaEthiopiaEuro areaEurope & Central AsiaEurope & Central Asia (excluding high income)Europe & Central Asia (IDA & IBRD countries)European UnionFaroe IslandsFijiFinlandFragile and conflict affected situationsFranceFrench PolynesiaGabonGambia, TheGeorgiaGermanyGhanaGibraltarGreeceGreenlandGrenadaGuamGuatemalaGuineaGuinea-BissauGuyanaHaitiHeavily indebted poor countries (HIPC)High incomeHondurasHong Kong SAR, ChinaHungaryIBRD onlyIcelandIDA & IBRD totalIDA blendIDA onlyIDA totalIndiaIndonesiaIran, Islamic Rep.IraqIrelandIsraelItalyJamaicaJapanJordanKazakhstanKenyaKiribatiKorea, Dem. People’s Rep.Korea, Rep.KuwaitKyrgyz RepublicLao PDRLate-demographic dividendLatin America & Caribbean Latin America & Caribbean (excluding high income)Latin America & the Caribbean (IDA & IBRD countries)LatviaLeast developed countries: UN classificationLebanonLesothoLiberiaLibyaLithuaniaLow & middle incomeLow incomeLower middle incomeLuxembourgMacao SAR, ChinaMacedonia, FYRMadagascarMalawiMalaysiaMaldivesMaliMaltaMarshall IslandsMauritaniaMauritiusMexicoMicronesia, Fed. Sts.Middle East & North AfricaMiddle East & North Africa (excluding high income)Middle East & North Africa (IDA & IBRD countries)Middle incomeMoldovaMongoliaMoroccoMozambiqueMyanmarNamibiaNauruNepalNetherlandsNew CaledoniaNew ZealandNicaraguaNigerNigeriaNorth AmericaNorthern Mariana IslandsNorwayOECD membersOmanOther small statesPacific island small statesPakistanPalauPanamaPapua New GuineaParaguayPeruPhilippinesPolandPortugalPost-demographic dividendPre-demographic dividendPuerto RicoQatarRomaniaRussian FederationRwandaSamoaSao Tome and PrincipeSaudi ArabiaSenegalSerbiaSeychellesSierra LeoneSingaporeSlovak RepublicSloveniaSmall statesSolomon IslandsSomaliaSouth AfricaSouth AsiaSouth Asia (IDA & IBRD)SpainSri LankaSt. Kitts and NevisSt. LuciaSt. Vincent and the GrenadinesSub-Saharan Africa Sub-Saharan Africa (excluding high income)Sub-Saharan Africa (IDA & IBRD countries)SudanSurinameSwazilandSwedenSwitzerlandSyrian Arab RepublicTajikistanTanzaniaThailandTimor-LesteTogoTongaTrinidad and TobagoTunisiaTurkeyTurkmenistanTurks and Caicos IslandsTuvaluUgandaUkraineUnited Arab EmiratesUnited KingdomUnited StatesUpper middle incomeUruguayUzbekistanVanuatuVenezuela, RBVietnamVirgin Islands (U.S.)WorldYemen, Rep.ZambiaZimbabwe Timeline:
This timeline shows a graph from 1971 to 2009 of Vietnam. No data until 1970. Number of actual observations by date: 39.
Source name:
World Development Indicators
Source organization:
World Bank staff estimates from original source: European Commission, Joint Research Centre (JRC)/Netherlands Environmental Assessment Agency (PBL). Emission Database for Global Atmospheric Research (EDGAR): http://edgar.jrc.ec.europa.eu/.
Categories, topics:
Energy & Mining, Environment
Last updated:
apr 23, 2017
Indicators value changes by year
At the date of observation
Value
Absolute change
Change from previous value
jan 1, 1971
8.404
+8.404
0.0%
jan 1, 1972
9.909
+1.504
17.9%
jan 1, 1973
9.6
-0.309
-3.12%
jan 1, 1974
8.899
-0.701
-7.3%
jan 1, 1975
9.713
+0.814
9.15%
jan 1, 1976
9.598
-0.116
-1.19%
jan 1, 1977
9.104
-0.494
-5.15%
jan 1, 1978
8.219
-0.885
-9.72%
jan 1, 1979
8.494
+0.275
3.35%
jan 1, 1980
9.664
+1.169
13.77%
jan 1, 1981
9.793
+0.129
1.34%
jan 1, 1982
9.632
-0.161
-1.64%
jan 1, 1983
9.219
-0.413
-4.28%
jan 1, 1984
7.754
-1.465
-15.89%
jan 1, 1985
8.401
+0.646
8.34%
jan 1, 1986
7.971
-0.43
-5.12%
jan 1, 1987
7.521
-0.449
-5.64%
jan 1, 1988
7.441
-0.081
-1.07%
jan 1, 1989
7.386
-0.055
-0.73%
jan 1, 1990
7.533
+0.147
1.99%
jan 1, 1991
7.382
-0.151
-2.0%
jan 1, 1992
6.819
-0.563
-7.63%
jan 1, 1993
6.762
-0.058
-0.85%
jan 1, 1994
7.128
+0.366
5.42%
jan 1, 1995
6.375
-0.753
-10.56%
jan 1, 1996
6.631
+0.256
4.02%
jan 1, 1997
6.468
-0.163
-2.46%
jan 1, 1998
6.796
+0.328
5.08%
jan 1, 1999
5.218
-1.578
-23.23%
jan 1, 2000
5.814
+0.597
11.43%
jan 1, 2001
6.055
+0.24
4.14%
jan 1, 2002
6.561
+0.506
8.36%
jan 1, 2003
5.811
-0.75
-11.43%
jan 1, 2004
5.87
+0.059
1.02%
jan 1, 2005
6.101
+0.231
3.93%
jan 1, 2006
6.123
+0.022
0.37%
jan 1, 2007
6.37
+0.247
4.03%
jan 1, 2008
6.495
+0.125
1.95%
jan 1, 2009
6.682
+0.187
2.89%
Ranking of countries by current statistics by years


Comments: