29
/
en
AIzaSyAYiBZKx7MnpbEhh9jyipgxe19OcubqV5w
April 1, 2024
175689
Latvia
LVA
true
2
1
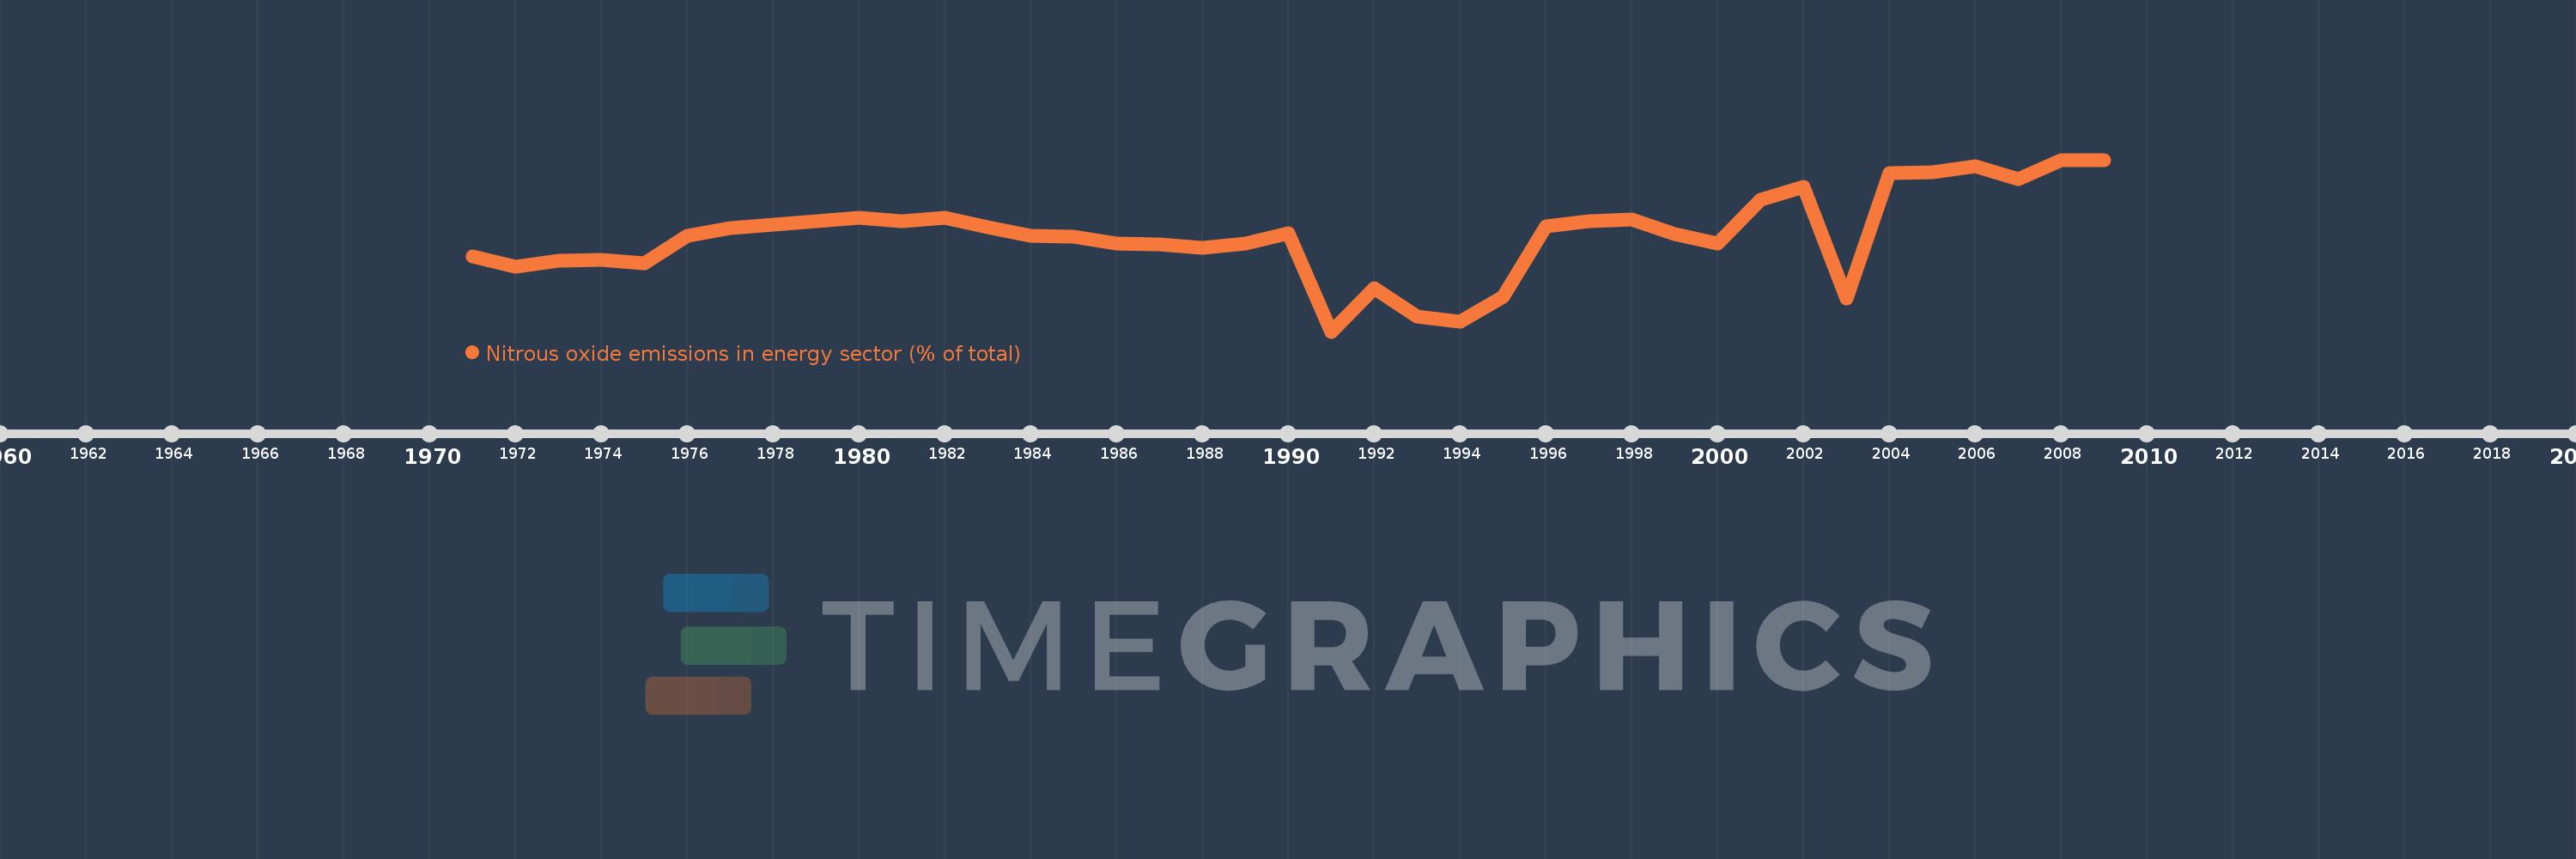
Nitrous oxide emissions in energy sector (% of total)
2009,2008,2007,2006,2005,2004,2003,2002,2001,2000,1999,1998,1997,1996,1995,1994,1993,1992,1991,1990,1989,1988,1987,1986,1985,1984,1983,1982,1981,1980,1979,1978,1977,1976,1975,1974,1973,1972,1971
This statistics in other country:
AfghanistanAlbaniaAlgeriaAmerican SamoaAndorraAngolaAntigua and BarbudaArab WorldArgentinaArmeniaArubaAustraliaAustriaAzerbaijanBahamas, TheBahrainBangladeshBarbadosBelarusBelgiumBelizeBeninBermudaBhutanBoliviaBosnia and HerzegovinaBotswanaBrazilBritish Virgin IslandsBrunei DarussalamBulgariaBurkina FasoBurundiCabo VerdeCambodiaCameroonCanadaCaribbean small statesCayman IslandsCentral African RepublicCentral Europe and the BalticsChadChileChinaColombiaComorosCongo, Dem. Rep.Congo, Rep.Costa RicaCote d'IvoireCroatiaCubaCyprusCzech RepublicDenmarkDjiboutiDominicaDominican RepublicEarly-demographic dividendEast Asia & PacificEast Asia & Pacific (excluding high income)East Asia & Pacific (IDA & IBRD countries)EcuadorEgypt, Arab Rep.El SalvadorEquatorial GuineaEritreaEstoniaEthiopiaEuro areaEurope & Central AsiaEurope & Central Asia (excluding high income)Europe & Central Asia (IDA & IBRD countries)European UnionFaroe IslandsFijiFinlandFragile and conflict affected situationsFranceFrench PolynesiaGabonGambia, TheGeorgiaGermanyGhanaGibraltarGreeceGreenlandGrenadaGuamGuatemalaGuineaGuinea-BissauGuyanaHaitiHeavily indebted poor countries (HIPC)High incomeHondurasHong Kong SAR, ChinaHungaryIBRD onlyIcelandIDA & IBRD totalIDA blendIDA onlyIDA totalIndiaIndonesiaIran, Islamic Rep.IraqIrelandIsraelItalyJamaicaJapanJordanKazakhstanKenyaKiribatiKorea, Dem. People’s Rep.Korea, Rep.KuwaitKyrgyz RepublicLao PDRLate-demographic dividendLatin America & Caribbean Latin America & Caribbean (excluding high income)Latin America & the Caribbean (IDA & IBRD countries)LatviaLeast developed countries: UN classificationLebanonLesothoLiberiaLibyaLithuaniaLow & middle incomeLow incomeLower middle incomeLuxembourgMacao SAR, ChinaMacedonia, FYRMadagascarMalawiMalaysiaMaldivesMaliMaltaMarshall IslandsMauritaniaMauritiusMexicoMicronesia, Fed. Sts.Middle East & North AfricaMiddle East & North Africa (excluding high income)Middle East & North Africa (IDA & IBRD countries)Middle incomeMoldovaMongoliaMoroccoMozambiqueMyanmarNamibiaNauruNepalNetherlandsNew CaledoniaNew ZealandNicaraguaNigerNigeriaNorth AmericaNorthern Mariana IslandsNorwayOECD membersOmanOther small statesPacific island small statesPakistanPalauPanamaPapua New GuineaParaguayPeruPhilippinesPolandPortugalPost-demographic dividendPre-demographic dividendPuerto RicoQatarRomaniaRussian FederationRwandaSamoaSao Tome and PrincipeSaudi ArabiaSenegalSerbiaSeychellesSierra LeoneSingaporeSlovak RepublicSloveniaSmall statesSolomon IslandsSomaliaSouth AfricaSouth AsiaSouth Asia (IDA & IBRD)SpainSri LankaSt. Kitts and NevisSt. LuciaSt. Vincent and the GrenadinesSub-Saharan Africa Sub-Saharan Africa (excluding high income)Sub-Saharan Africa (IDA & IBRD countries)SudanSurinameSwazilandSwedenSwitzerlandSyrian Arab RepublicTajikistanTanzaniaThailandTimor-LesteTogoTongaTrinidad and TobagoTunisiaTurkeyTurkmenistanTurks and Caicos IslandsTuvaluUgandaUkraineUnited Arab EmiratesUnited KingdomUnited StatesUpper middle incomeUruguayUzbekistanVanuatuVenezuela, RBVietnamVirgin Islands (U.S.)WorldYemen, Rep.ZambiaZimbabwe Timeline:
This timeline shows a graph from 1971 to 2009 of Latvia. No data until 1970. Number of actual observations by date: 39.
Source name:
World Development Indicators
Source organization:
World Bank staff estimates from original source: European Commission, Joint Research Centre (JRC)/Netherlands Environmental Assessment Agency (PBL). Emission Database for Global Atmospheric Research (EDGAR): http://edgar.jrc.ec.europa.eu/.
Categories, topics:
Energy & Mining, Environment
Last updated:
apr 23, 2017
Indicators value changes by year
Maximum:
12.217
jan 1, 2009
At the date of observation
Value
Absolute change
Change from previous value
jan 1, 1971
9.089
+9.089
0.0%
jan 1, 1972
8.769
-0.321
-3.53%
jan 1, 1973
8.95
+0.182
2.07%
jan 1, 1974
8.983
+0.033
0.37%
jan 1, 1975
8.885
-0.098
-1.09%
jan 1, 1976
9.76
+0.875
9.84%
jan 1, 1977
10.007
+0.247
2.54%
jan 1, 1978
10.118
+0.111
1.11%
jan 1, 1979
10.224
+0.106
1.05%
jan 1, 1980
10.356
+0.132
1.29%
jan 1, 1981
10.251
-0.105
-1.01%
jan 1, 1982
10.34
+0.089
0.86%
jan 1, 1983
10.03
-0.31
-2.99%
jan 1, 1984
9.774
-0.257
-2.56%
jan 1, 1985
9.73
-0.044
-0.45%
jan 1, 1986
9.508
-0.222
-2.28%
jan 1, 1987
9.476
-0.032
-0.34%
jan 1, 1988
9.368
-0.109
-1.15%
jan 1, 1989
9.514
+0.146
1.56%
jan 1, 1990
9.851
+0.337
3.54%
jan 1, 1991
6.679
-3.172
-32.2%
jan 1, 1992
8.081
+1.402
20.99%
jan 1, 1993
7.159
-0.922
-11.41%
jan 1, 1994
6.998
-0.161
-2.25%
jan 1, 1995
7.796
+0.798
11.4%
jan 1, 1996
10.065
+2.269
29.1%
jan 1, 1997
10.244
+0.179
1.78%
jan 1, 1998
10.302
+0.058
0.56%
jan 1, 1999
9.821
-0.481
-4.67%
jan 1, 2000
9.504
-0.317
-3.23%
jan 1, 2001
10.935
+1.431
15.05%
jan 1, 2002
11.348
+0.413
3.78%
jan 1, 2003
7.734
-3.614
-31.85%
jan 1, 2004
11.785
+4.051
52.38%
jan 1, 2005
11.806
+0.022
0.18%
jan 1, 2006
12.019
+0.212
1.8%
jan 1, 2007
11.598
-0.421
-3.5%
jan 1, 2008
12.193
+0.595
5.13%
jan 1, 2009
12.217
+0.024
0.2%
Ranking of countries by current statistics by years


Comments: