29
/
en
AIzaSyAYiBZKx7MnpbEhh9jyipgxe19OcubqV5w
April 1, 2024
29376
East Asia & Pacific (IDA & IBRD countries)
TEA
false
2
1
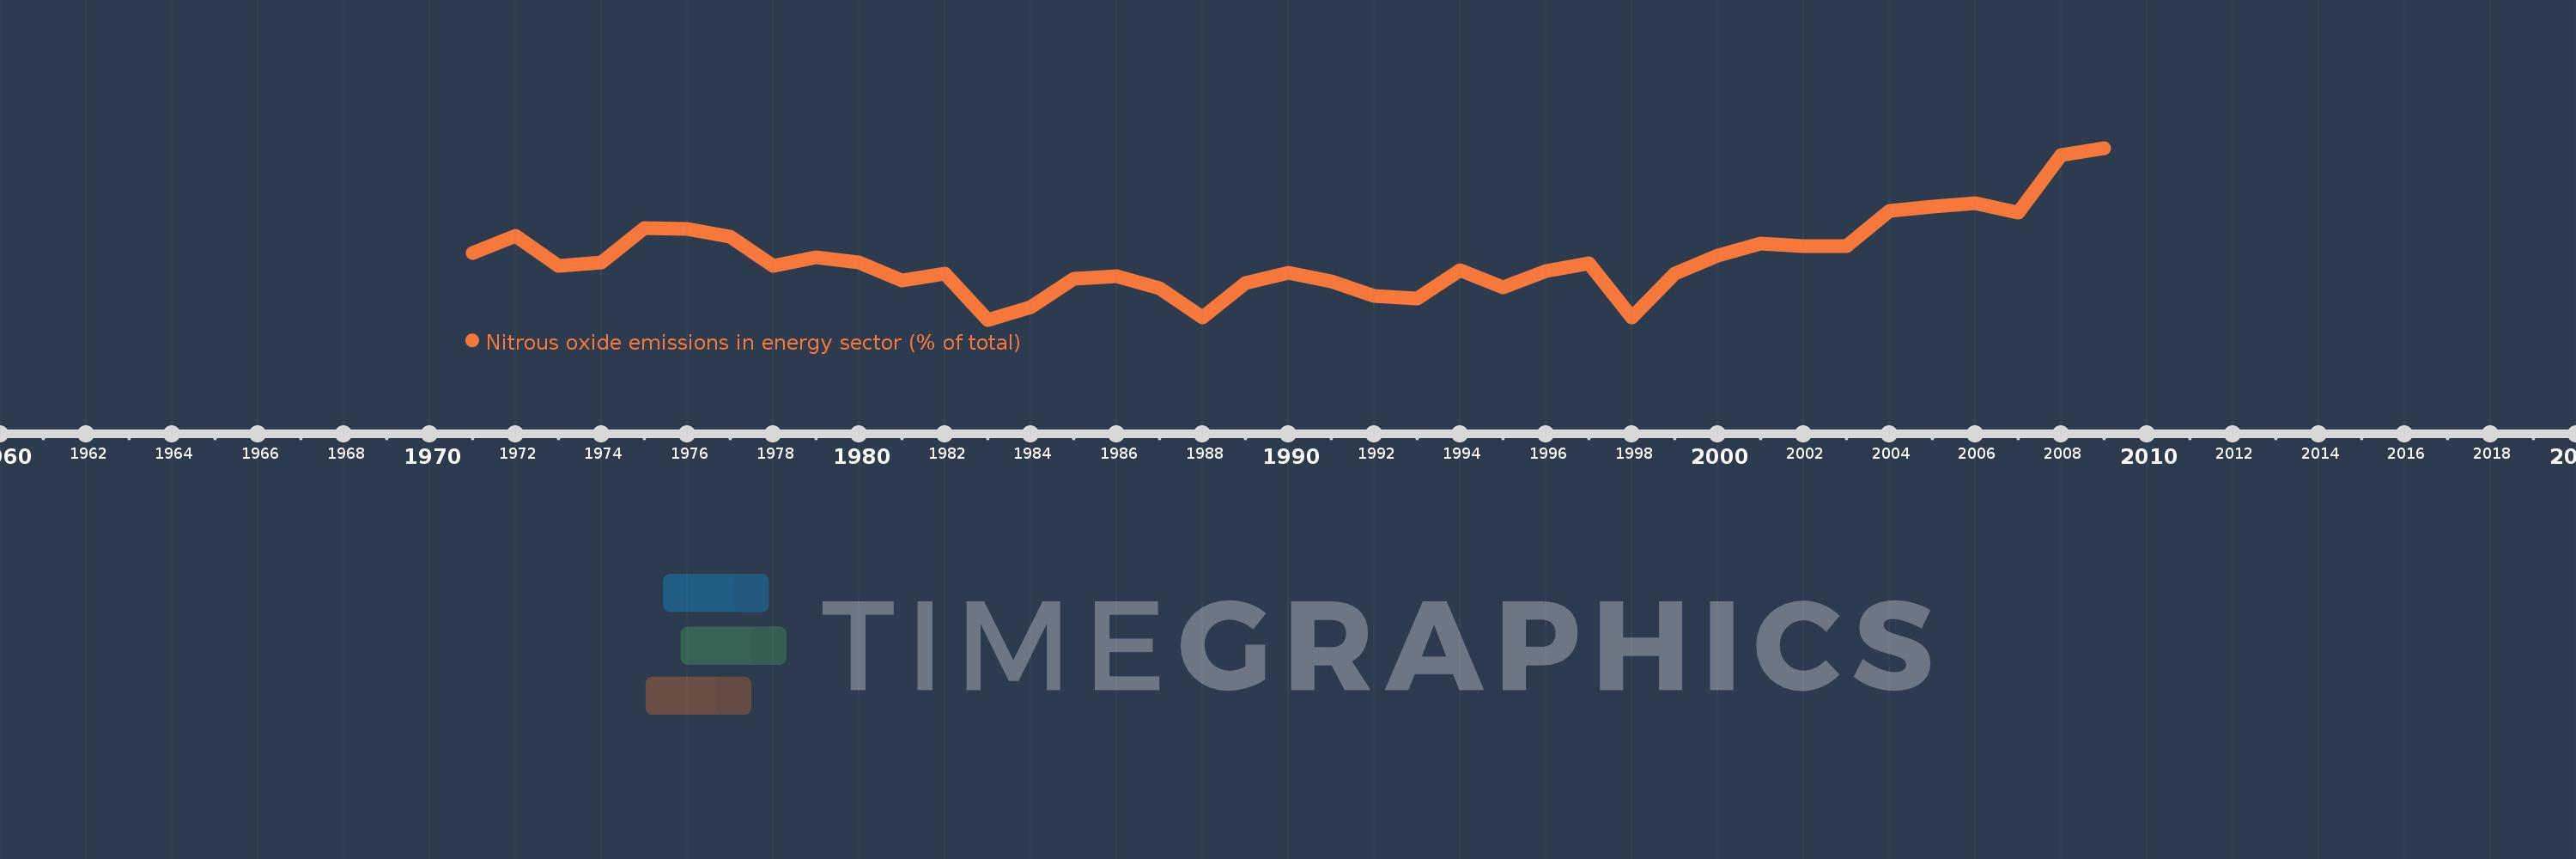
Nitrous oxide emissions in energy sector (% of total)
2009,2008,2007,2006,2005,2004,2003,2002,2001,2000,1999,1998,1997,1996,1995,1994,1993,1992,1991,1990,1989,1988,1987,1986,1985,1984,1983,1982,1981,1980,1979,1978,1977,1976,1975,1974,1973,1972,1971
This statistics in other country:
AfghanistanAlbaniaAlgeriaAmerican SamoaAndorraAngolaAntigua and BarbudaArab WorldArgentinaArmeniaArubaAustraliaAustriaAzerbaijanBahamas, TheBahrainBangladeshBarbadosBelarusBelgiumBelizeBeninBermudaBhutanBoliviaBosnia and HerzegovinaBotswanaBrazilBritish Virgin IslandsBrunei DarussalamBulgariaBurkina FasoBurundiCabo VerdeCambodiaCameroonCanadaCaribbean small statesCayman IslandsCentral African RepublicCentral Europe and the BalticsChadChileChinaColombiaComorosCongo, Dem. Rep.Congo, Rep.Costa RicaCote d'IvoireCroatiaCubaCyprusCzech RepublicDenmarkDjiboutiDominicaDominican RepublicEarly-demographic dividendEast Asia & PacificEast Asia & Pacific (excluding high income)East Asia & Pacific (IDA & IBRD countries)EcuadorEgypt, Arab Rep.El SalvadorEquatorial GuineaEritreaEstoniaEthiopiaEuro areaEurope & Central AsiaEurope & Central Asia (excluding high income)Europe & Central Asia (IDA & IBRD countries)European UnionFaroe IslandsFijiFinlandFragile and conflict affected situationsFranceFrench PolynesiaGabonGambia, TheGeorgiaGermanyGhanaGibraltarGreeceGreenlandGrenadaGuamGuatemalaGuineaGuinea-BissauGuyanaHaitiHeavily indebted poor countries (HIPC)High incomeHondurasHong Kong SAR, ChinaHungaryIBRD onlyIcelandIDA & IBRD totalIDA blendIDA onlyIDA totalIndiaIndonesiaIran, Islamic Rep.IraqIrelandIsraelItalyJamaicaJapanJordanKazakhstanKenyaKiribatiKorea, Dem. People’s Rep.Korea, Rep.KuwaitKyrgyz RepublicLao PDRLate-demographic dividendLatin America & Caribbean Latin America & Caribbean (excluding high income)Latin America & the Caribbean (IDA & IBRD countries)LatviaLeast developed countries: UN classificationLebanonLesothoLiberiaLibyaLithuaniaLow & middle incomeLow incomeLower middle incomeLuxembourgMacao SAR, ChinaMacedonia, FYRMadagascarMalawiMalaysiaMaldivesMaliMaltaMarshall IslandsMauritaniaMauritiusMexicoMicronesia, Fed. Sts.Middle East & North AfricaMiddle East & North Africa (excluding high income)Middle East & North Africa (IDA & IBRD countries)Middle incomeMoldovaMongoliaMoroccoMozambiqueMyanmarNamibiaNauruNepalNetherlandsNew CaledoniaNew ZealandNicaraguaNigerNigeriaNorth AmericaNorthern Mariana IslandsNorwayOECD membersOmanOther small statesPacific island small statesPakistanPalauPanamaPapua New GuineaParaguayPeruPhilippinesPolandPortugalPost-demographic dividendPre-demographic dividendPuerto RicoQatarRomaniaRussian FederationRwandaSamoaSao Tome and PrincipeSaudi ArabiaSenegalSerbiaSeychellesSierra LeoneSingaporeSlovak RepublicSloveniaSmall statesSolomon IslandsSomaliaSouth AfricaSouth AsiaSouth Asia (IDA & IBRD)SpainSri LankaSt. Kitts and NevisSt. LuciaSt. Vincent and the GrenadinesSub-Saharan Africa Sub-Saharan Africa (excluding high income)Sub-Saharan Africa (IDA & IBRD countries)SudanSurinameSwazilandSwedenSwitzerlandSyrian Arab RepublicTajikistanTanzaniaThailandTimor-LesteTogoTongaTrinidad and TobagoTunisiaTurkeyTurkmenistanTurks and Caicos IslandsTuvaluUgandaUkraineUnited Arab EmiratesUnited KingdomUnited StatesUpper middle incomeUruguayUzbekistanVanuatuVenezuela, RBVietnamVirgin Islands (U.S.)WorldYemen, Rep.ZambiaZimbabwe Timeline:
This timeline shows a graph from 1971 to 2009 of East Asia & Pacific (IDA & IBRD countries). No data until 1970. Number of actual observations by date: 39.
Source name:
World Development Indicators
Source organization:
World Bank staff estimates from original source: European Commission, Joint Research Centre (JRC)/Netherlands Environmental Assessment Agency (PBL). Emission Database for Global Atmospheric Research (EDGAR): http://edgar.jrc.ec.europa.eu/.
Categories, topics:
Energy & Mining, Environment
Last updated:
apr 23, 2017
Indicators value changes by year
At the date of observation
Value
Absolute change
Change from previous value
jan 1, 1971
5.914
+5.914
0.0%
jan 1, 1972
6.408
+0.494
8.35%
jan 1, 1973
5.563
-0.846
-13.19%
jan 1, 1974
5.655
+0.092
1.66%
jan 1, 1975
6.624
+0.969
17.14%
jan 1, 1976
6.618
-0.006
-0.09%
jan 1, 1977
6.384
-0.234
-3.54%
jan 1, 1978
5.548
-0.836
-13.09%
jan 1, 1979
5.812
+0.264
4.76%
jan 1, 1980
5.652
-0.16
-2.76%
jan 1, 1981
5.144
-0.508
-8.99%
jan 1, 1982
5.338
+0.194
3.77%
jan 1, 1983
4.029
-1.308
-24.51%
jan 1, 1984
4.398
+0.368
9.15%
jan 1, 1985
5.204
+0.806
18.32%
jan 1, 1986
5.266
+0.062
1.2%
jan 1, 1987
4.928
-0.338
-6.42%
jan 1, 1988
4.098
-0.83
-16.83%
jan 1, 1989
5.069
+0.971
23.7%
jan 1, 1990
5.365
+0.296
5.84%
jan 1, 1991
5.131
-0.234
-4.37%
jan 1, 1992
4.695
-0.436
-8.5%
jan 1, 1993
4.634
-0.061
-1.3%
jan 1, 1994
5.438
+0.804
17.35%
jan 1, 1995
4.945
-0.493
-9.06%
jan 1, 1996
5.404
+0.458
9.27%
jan 1, 1997
5.64
+0.236
4.38%
jan 1, 1998
4.095
-1.545
-27.4%
jan 1, 1999
5.341
+1.246
30.43%
jan 1, 2000
5.86
+0.519
9.72%
jan 1, 2001
6.201
+0.341
5.82%
jan 1, 2002
6.128
-0.072
-1.17%
jan 1, 2003
6.111
-0.017
-0.28%
jan 1, 2004
7.132
+1.021
16.71%
jan 1, 2005
7.233
+0.101
1.41%
jan 1, 2006
7.338
+0.105
1.45%
jan 1, 2007
7.069
-0.269
-3.66%
jan 1, 2008
8.704
+1.635
23.13%
jan 1, 2009
8.91
+0.206
2.36%
Ranking of countries by current statistics by years


Comments: