29
/
en
AIzaSyAYiBZKx7MnpbEhh9jyipgxe19OcubqV5w
April 1, 2024
37653
IDA & IBRD total
IBT
false
2
1
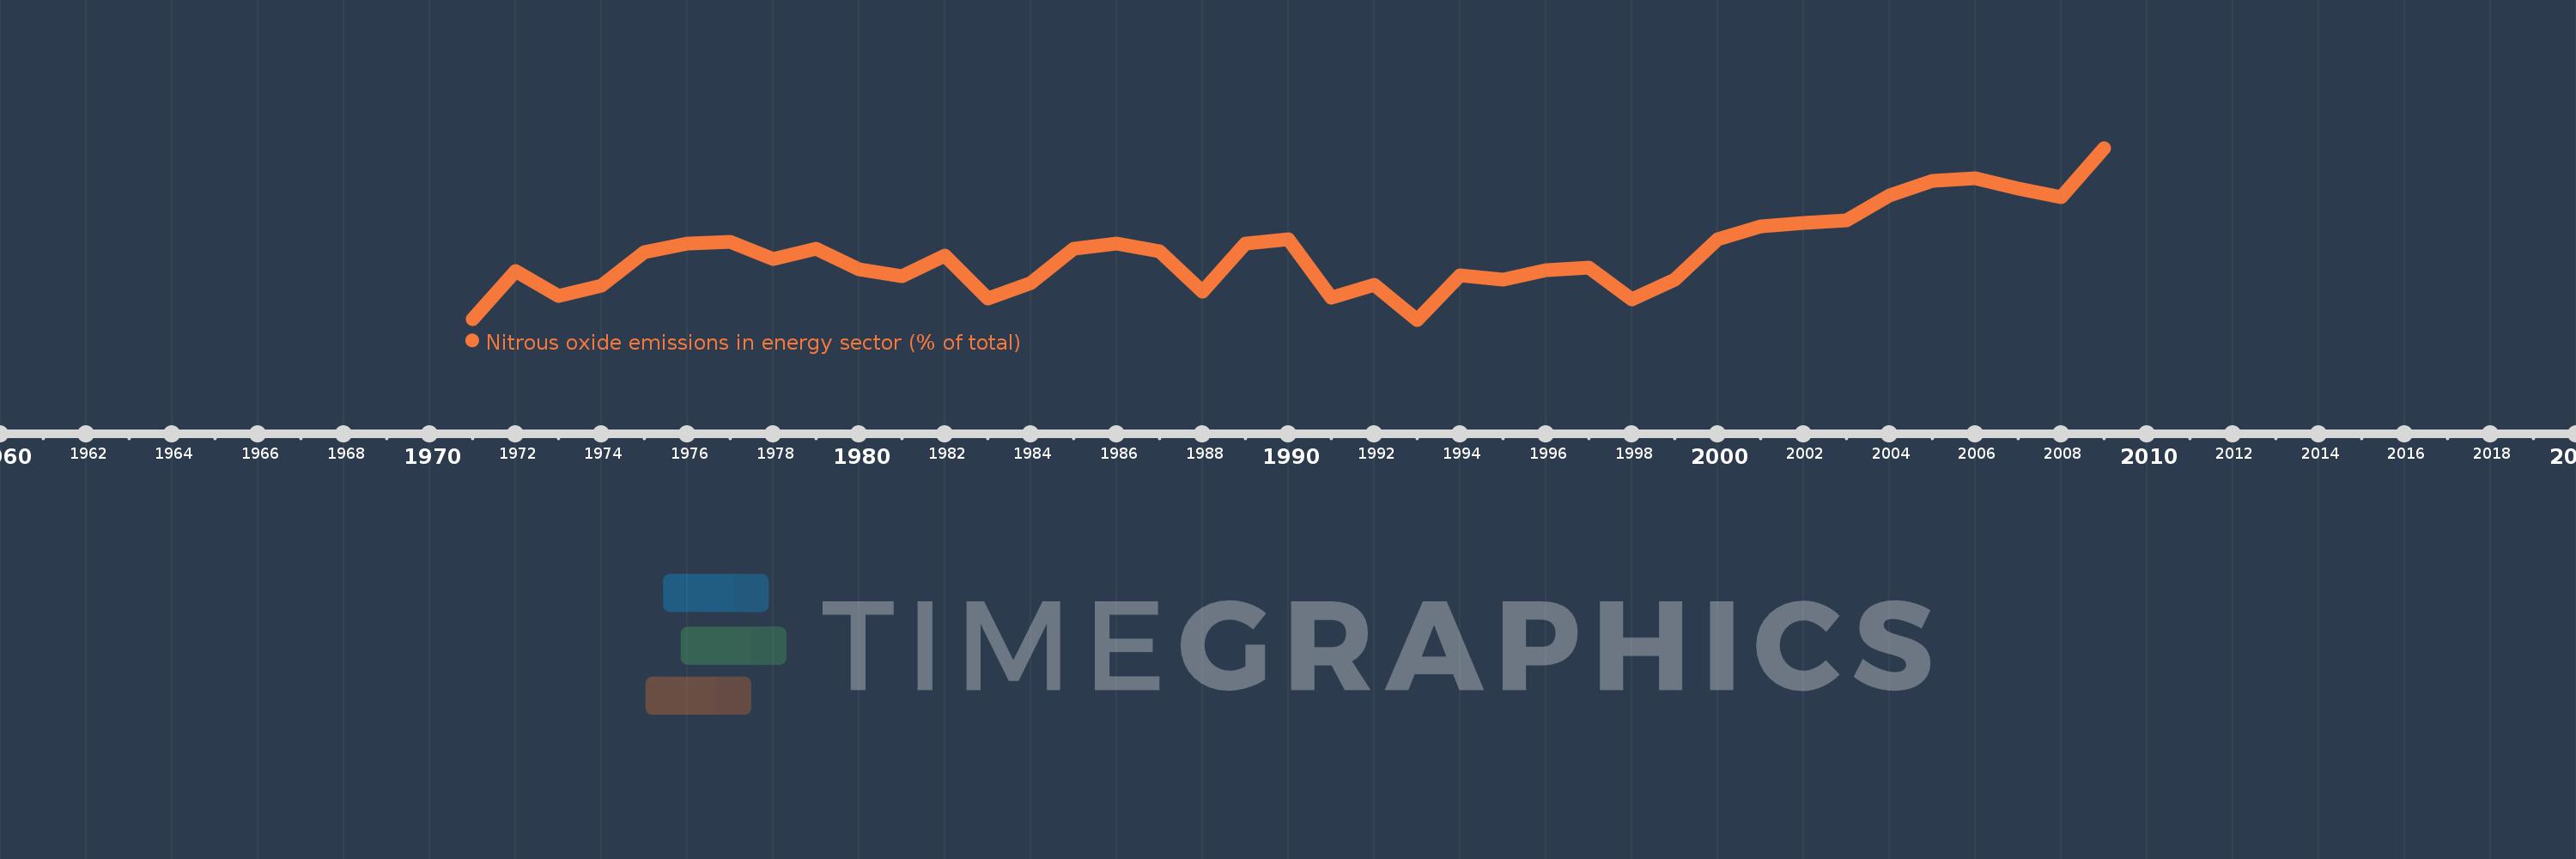
Nitrous oxide emissions in energy sector (% of total)
2009,2008,2007,2006,2005,2004,2003,2002,2001,2000,1999,1998,1997,1996,1995,1994,1993,1992,1991,1990,1989,1988,1987,1986,1985,1984,1983,1982,1981,1980,1979,1978,1977,1976,1975,1974,1973,1972,1971
This statistics in other country:
AfghanistanAlbaniaAlgeriaAmerican SamoaAndorraAngolaAntigua and BarbudaArab WorldArgentinaArmeniaArubaAustraliaAustriaAzerbaijanBahamas, TheBahrainBangladeshBarbadosBelarusBelgiumBelizeBeninBermudaBhutanBoliviaBosnia and HerzegovinaBotswanaBrazilBritish Virgin IslandsBrunei DarussalamBulgariaBurkina FasoBurundiCabo VerdeCambodiaCameroonCanadaCaribbean small statesCayman IslandsCentral African RepublicCentral Europe and the BalticsChadChileChinaColombiaComorosCongo, Dem. Rep.Congo, Rep.Costa RicaCote d'IvoireCroatiaCubaCyprusCzech RepublicDenmarkDjiboutiDominicaDominican RepublicEarly-demographic dividendEast Asia & PacificEast Asia & Pacific (excluding high income)East Asia & Pacific (IDA & IBRD countries)EcuadorEgypt, Arab Rep.El SalvadorEquatorial GuineaEritreaEstoniaEthiopiaEuro areaEurope & Central AsiaEurope & Central Asia (excluding high income)Europe & Central Asia (IDA & IBRD countries)European UnionFaroe IslandsFijiFinlandFragile and conflict affected situationsFranceFrench PolynesiaGabonGambia, TheGeorgiaGermanyGhanaGibraltarGreeceGreenlandGrenadaGuamGuatemalaGuineaGuinea-BissauGuyanaHaitiHeavily indebted poor countries (HIPC)High incomeHondurasHong Kong SAR, ChinaHungaryIBRD onlyIcelandIDA & IBRD totalIDA blendIDA onlyIDA totalIndiaIndonesiaIran, Islamic Rep.IraqIrelandIsraelItalyJamaicaJapanJordanKazakhstanKenyaKiribatiKorea, Dem. People’s Rep.Korea, Rep.KuwaitKyrgyz RepublicLao PDRLate-demographic dividendLatin America & Caribbean Latin America & Caribbean (excluding high income)Latin America & the Caribbean (IDA & IBRD countries)LatviaLeast developed countries: UN classificationLebanonLesothoLiberiaLibyaLithuaniaLow & middle incomeLow incomeLower middle incomeLuxembourgMacao SAR, ChinaMacedonia, FYRMadagascarMalawiMalaysiaMaldivesMaliMaltaMarshall IslandsMauritaniaMauritiusMexicoMicronesia, Fed. Sts.Middle East & North AfricaMiddle East & North Africa (excluding high income)Middle East & North Africa (IDA & IBRD countries)Middle incomeMoldovaMongoliaMoroccoMozambiqueMyanmarNamibiaNauruNepalNetherlandsNew CaledoniaNew ZealandNicaraguaNigerNigeriaNorth AmericaNorthern Mariana IslandsNorwayOECD membersOmanOther small statesPacific island small statesPakistanPalauPanamaPapua New GuineaParaguayPeruPhilippinesPolandPortugalPost-demographic dividendPre-demographic dividendPuerto RicoQatarRomaniaRussian FederationRwandaSamoaSao Tome and PrincipeSaudi ArabiaSenegalSerbiaSeychellesSierra LeoneSingaporeSlovak RepublicSloveniaSmall statesSolomon IslandsSomaliaSouth AfricaSouth AsiaSouth Asia (IDA & IBRD)SpainSri LankaSt. Kitts and NevisSt. LuciaSt. Vincent and the GrenadinesSub-Saharan Africa Sub-Saharan Africa (excluding high income)Sub-Saharan Africa (IDA & IBRD countries)SudanSurinameSwazilandSwedenSwitzerlandSyrian Arab RepublicTajikistanTanzaniaThailandTimor-LesteTogoTongaTrinidad and TobagoTunisiaTurkeyTurkmenistanTurks and Caicos IslandsTuvaluUgandaUkraineUnited Arab EmiratesUnited KingdomUnited StatesUpper middle incomeUruguayUzbekistanVanuatuVenezuela, RBVietnamVirgin Islands (U.S.)WorldYemen, Rep.ZambiaZimbabwe Timeline:
This timeline shows a graph from 1971 to 2009 of IDA & IBRD total. No data until 1970. Number of actual observations by date: 39.
Source name:
World Development Indicators
Source organization:
World Bank staff estimates from original source: European Commission, Joint Research Centre (JRC)/Netherlands Environmental Assessment Agency (PBL). Emission Database for Global Atmospheric Research (EDGAR): http://edgar.jrc.ec.europa.eu/.
Categories, topics:
Energy & Mining, Environment
Last updated:
apr 23, 2017
Indicators value changes by year
At the date of observation
Value
Absolute change
Change from previous value
jan 1, 1971
4.641
+4.641
0.0%
jan 1, 1972
5.244
+0.603
12.99%
jan 1, 1973
4.929
-0.315
-6.01%
jan 1, 1974
5.067
+0.138
2.8%
jan 1, 1975
5.487
+0.42
8.3%
jan 1, 1976
5.594
+0.107
1.95%
jan 1, 1977
5.622
+0.028
0.49%
jan 1, 1978
5.407
-0.214
-3.81%
jan 1, 1979
5.533
+0.126
2.33%
jan 1, 1980
5.266
-0.268
-4.84%
jan 1, 1981
5.186
-0.08
-1.51%
jan 1, 1982
5.443
+0.257
4.95%
jan 1, 1983
4.903
-0.54
-9.92%
jan 1, 1984
5.092
+0.189
3.85%
jan 1, 1985
5.538
+0.446
8.75%
jan 1, 1986
5.603
+0.065
1.17%
jan 1, 1987
5.498
-0.105
-1.87%
jan 1, 1988
4.99
-0.508
-9.24%
jan 1, 1989
5.603
+0.614
12.3%
jan 1, 1990
5.656
+0.052
0.93%
jan 1, 1991
4.906
-0.75
-13.25%
jan 1, 1992
5.078
+0.172
3.5%
jan 1, 1993
4.628
-0.449
-8.85%
jan 1, 1994
5.199
+0.571
12.33%
jan 1, 1995
5.138
-0.061
-1.18%
jan 1, 1996
5.261
+0.123
2.4%
jan 1, 1997
5.298
+0.036
0.69%
jan 1, 1998
4.884
-0.413
-7.8%
jan 1, 1999
5.14
+0.256
5.23%
jan 1, 2000
5.649
+0.509
9.9%
jan 1, 2001
5.822
+0.173
3.07%
jan 1, 2002
5.861
+0.038
0.66%
jan 1, 2003
5.892
+0.032
0.54%
jan 1, 2004
6.213
+0.321
5.45%
jan 1, 2005
6.396
+0.183
2.94%
jan 1, 2006
6.43
+0.034
0.53%
jan 1, 2007
6.303
-0.127
-1.98%
jan 1, 2008
6.192
-0.111
-1.76%
jan 1, 2009
6.818
+0.626
10.12%
Ranking of countries by current statistics by years


Comments: