29
/
en
AIzaSyAYiBZKx7MnpbEhh9jyipgxe19OcubqV5w
April 1, 2024
266106
Tonga
TON
true
2
1
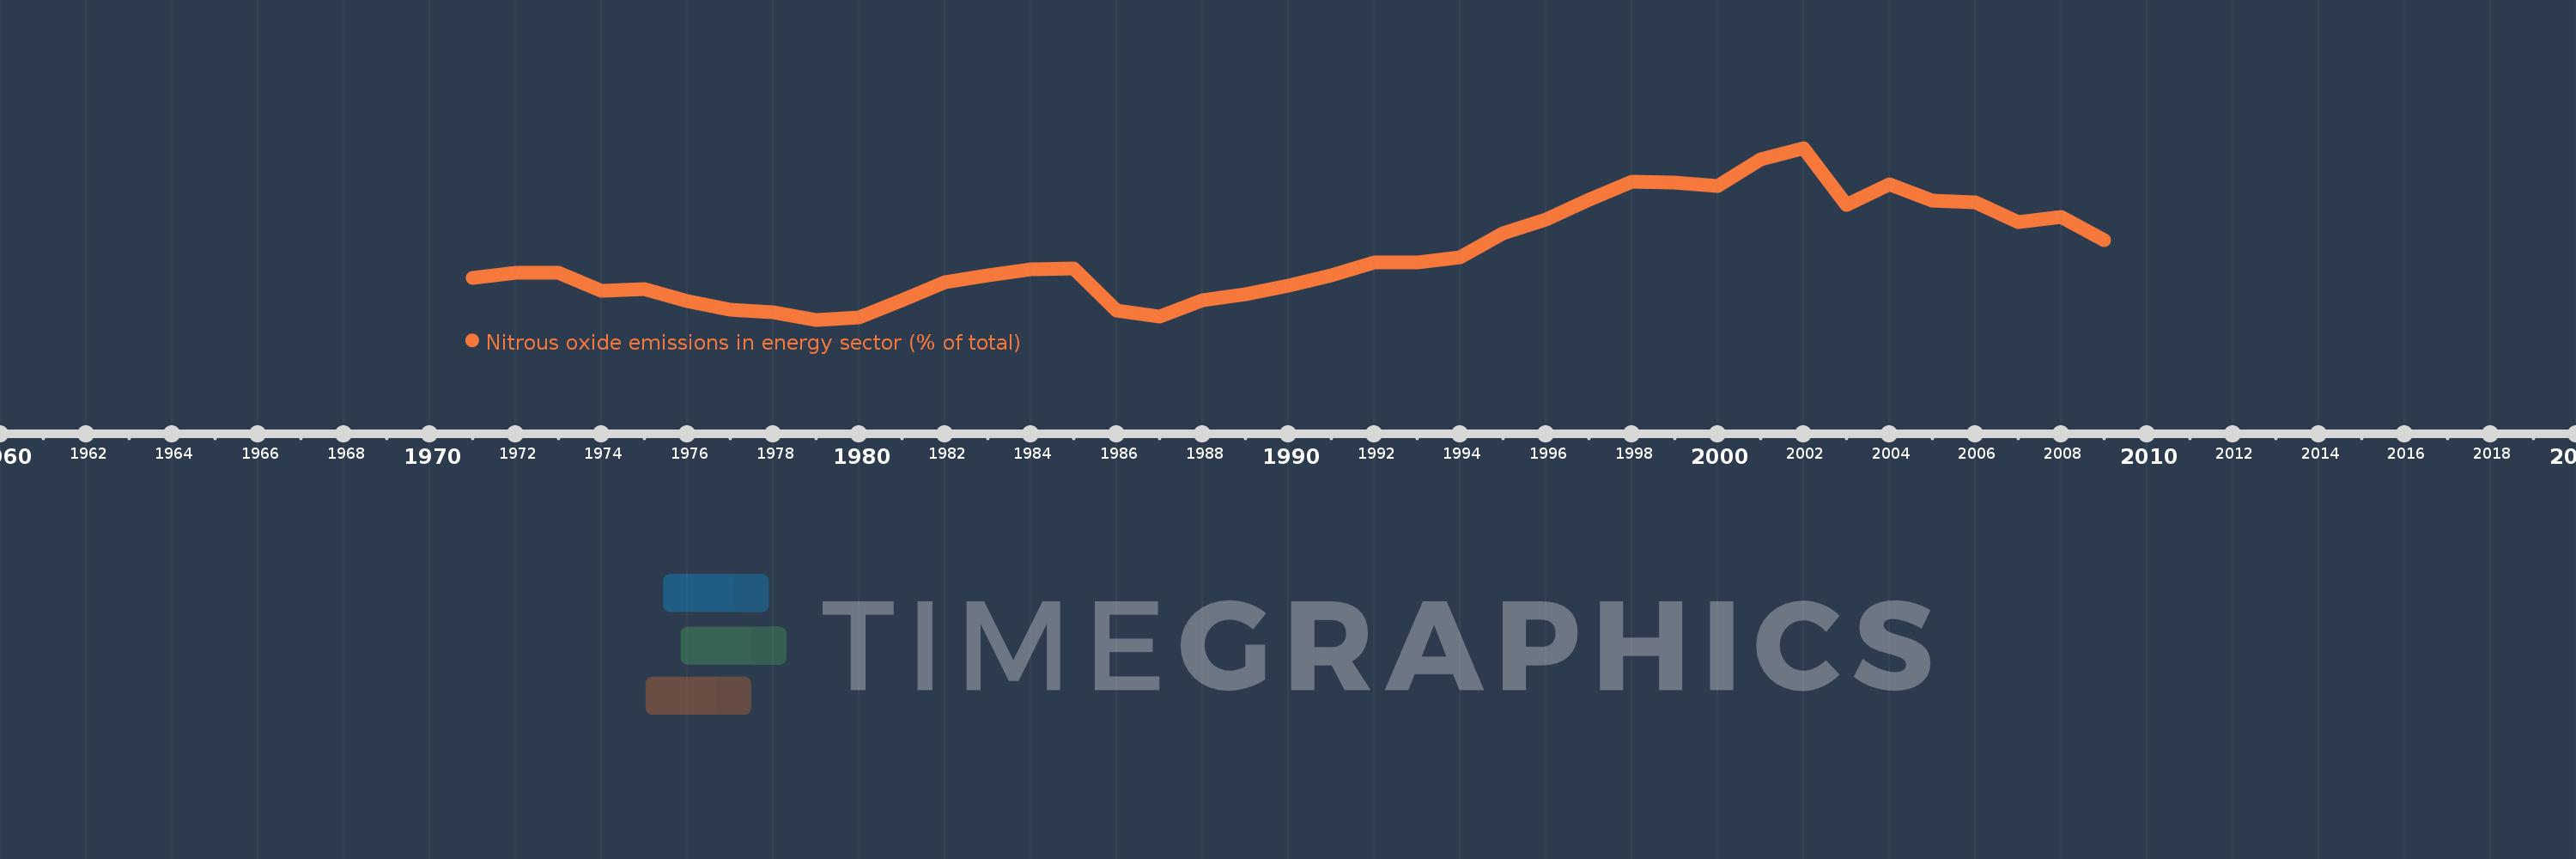
Nitrous oxide emissions in energy sector (% of total)
2009,2008,2007,2006,2005,2004,2003,2002,2001,2000,1999,1998,1997,1996,1995,1994,1993,1992,1991,1990,1989,1988,1987,1986,1985,1984,1983,1982,1981,1980,1979,1978,1977,1976,1975,1974,1973,1972,1971
This statistics in other country:
AfghanistanAlbaniaAlgeriaAmerican SamoaAndorraAngolaAntigua and BarbudaArab WorldArgentinaArmeniaArubaAustraliaAustriaAzerbaijanBahamas, TheBahrainBangladeshBarbadosBelarusBelgiumBelizeBeninBermudaBhutanBoliviaBosnia and HerzegovinaBotswanaBrazilBritish Virgin IslandsBrunei DarussalamBulgariaBurkina FasoBurundiCabo VerdeCambodiaCameroonCanadaCaribbean small statesCayman IslandsCentral African RepublicCentral Europe and the BalticsChadChileChinaColombiaComorosCongo, Dem. Rep.Congo, Rep.Costa RicaCote d'IvoireCroatiaCubaCyprusCzech RepublicDenmarkDjiboutiDominicaDominican RepublicEarly-demographic dividendEast Asia & PacificEast Asia & Pacific (excluding high income)East Asia & Pacific (IDA & IBRD countries)EcuadorEgypt, Arab Rep.El SalvadorEquatorial GuineaEritreaEstoniaEthiopiaEuro areaEurope & Central AsiaEurope & Central Asia (excluding high income)Europe & Central Asia (IDA & IBRD countries)European UnionFaroe IslandsFijiFinlandFragile and conflict affected situationsFranceFrench PolynesiaGabonGambia, TheGeorgiaGermanyGhanaGibraltarGreeceGreenlandGrenadaGuamGuatemalaGuineaGuinea-BissauGuyanaHaitiHeavily indebted poor countries (HIPC)High incomeHondurasHong Kong SAR, ChinaHungaryIBRD onlyIcelandIDA & IBRD totalIDA blendIDA onlyIDA totalIndiaIndonesiaIran, Islamic Rep.IraqIrelandIsraelItalyJamaicaJapanJordanKazakhstanKenyaKiribatiKorea, Dem. People’s Rep.Korea, Rep.KuwaitKyrgyz RepublicLao PDRLate-demographic dividendLatin America & Caribbean Latin America & Caribbean (excluding high income)Latin America & the Caribbean (IDA & IBRD countries)LatviaLeast developed countries: UN classificationLebanonLesothoLiberiaLibyaLithuaniaLow & middle incomeLow incomeLower middle incomeLuxembourgMacao SAR, ChinaMacedonia, FYRMadagascarMalawiMalaysiaMaldivesMaliMaltaMarshall IslandsMauritaniaMauritiusMexicoMicronesia, Fed. Sts.Middle East & North AfricaMiddle East & North Africa (excluding high income)Middle East & North Africa (IDA & IBRD countries)Middle incomeMoldovaMongoliaMoroccoMozambiqueMyanmarNamibiaNauruNepalNetherlandsNew CaledoniaNew ZealandNicaraguaNigerNigeriaNorth AmericaNorthern Mariana IslandsNorwayOECD membersOmanOther small statesPacific island small statesPakistanPalauPanamaPapua New GuineaParaguayPeruPhilippinesPolandPortugalPost-demographic dividendPre-demographic dividendPuerto RicoQatarRomaniaRussian FederationRwandaSamoaSao Tome and PrincipeSaudi ArabiaSenegalSerbiaSeychellesSierra LeoneSingaporeSlovak RepublicSloveniaSmall statesSolomon IslandsSomaliaSouth AfricaSouth AsiaSouth Asia (IDA & IBRD)SpainSri LankaSt. Kitts and NevisSt. LuciaSt. Vincent and the GrenadinesSub-Saharan Africa Sub-Saharan Africa (excluding high income)Sub-Saharan Africa (IDA & IBRD countries)SudanSurinameSwazilandSwedenSwitzerlandSyrian Arab RepublicTajikistanTanzaniaThailandTimor-LesteTogoTongaTrinidad and TobagoTunisiaTurkeyTurkmenistanTurks and Caicos IslandsTuvaluUgandaUkraineUnited Arab EmiratesUnited KingdomUnited StatesUpper middle incomeUruguayUzbekistanVanuatuVenezuela, RBVietnamVirgin Islands (U.S.)WorldYemen, Rep.ZambiaZimbabwe Timeline:
This timeline shows a graph from 1971 to 2009 of Tonga. No data until 1970. Number of actual observations by date: 39.
Source name:
World Development Indicators
Source organization:
World Bank staff estimates from original source: European Commission, Joint Research Centre (JRC)/Netherlands Environmental Assessment Agency (PBL). Emission Database for Global Atmospheric Research (EDGAR): http://edgar.jrc.ec.europa.eu/.
Categories, topics:
Energy & Mining, Environment
Last updated:
apr 23, 2017
Indicators value changes by year
At the date of observation
Value
Absolute change
Change from previous value
jan 1, 1971
2.235
+2.235
0.0%
jan 1, 1972
2.385
+0.15
6.73%
jan 1, 1973
2.379
-0.006
-0.26%
jan 1, 1974
1.891
-0.488
-20.53%
jan 1, 1975
1.923
+0.032
1.69%
jan 1, 1976
1.582
-0.34
-17.71%
jan 1, 1977
1.354
-0.229
-14.46%
jan 1, 1978
1.28
-0.074
-5.44%
jan 1, 1979
1.076
-0.204
-15.96%
jan 1, 1980
1.131
+0.055
5.15%
jan 1, 1981
1.62
+0.49
43.29%
jan 1, 1982
2.119
+0.498
30.76%
jan 1, 1983
2.318
+0.199
9.41%
jan 1, 1984
2.486
+0.168
7.26%
jan 1, 1985
2.509
+0.022
0.9%
jan 1, 1986
1.339
-1.17
-46.62%
jan 1, 1987
1.153
-0.186
-13.91%
jan 1, 1988
1.606
+0.453
39.3%
jan 1, 1989
1.775
+0.169
10.53%
jan 1, 1990
2.017
+0.242
13.63%
jan 1, 1991
2.302
+0.285
14.15%
jan 1, 1992
2.661
+0.358
15.57%
jan 1, 1993
2.665
+0.004
0.15%
jan 1, 1994
2.81
+0.145
5.43%
jan 1, 1995
3.48
+0.671
23.88%
jan 1, 1996
3.849
+0.368
10.58%
jan 1, 1997
4.411
+0.562
14.61%
jan 1, 1998
4.912
+0.5
11.35%
jan 1, 1999
4.889
-0.023
-0.47%
jan 1, 2000
4.799
-0.089
-1.83%
jan 1, 2001
5.536
+0.736
15.34%
jan 1, 2002
5.843
+0.308
5.56%
jan 1, 2003
4.258
-1.585
-27.12%
jan 1, 2004
4.841
+0.582
13.68%
jan 1, 2005
4.372
-0.469
-9.69%
jan 1, 2006
4.338
-0.034
-0.78%
jan 1, 2007
3.786
-0.552
-12.72%
jan 1, 2008
3.928
+0.142
3.75%
jan 1, 2009
3.278
-0.65
-16.55%
Ranking of countries by current statistics by years


Comments: