29
/
en
AIzaSyAYiBZKx7MnpbEhh9jyipgxe19OcubqV5w
April 1, 2024
153858
Iceland
ISL
true
2
1
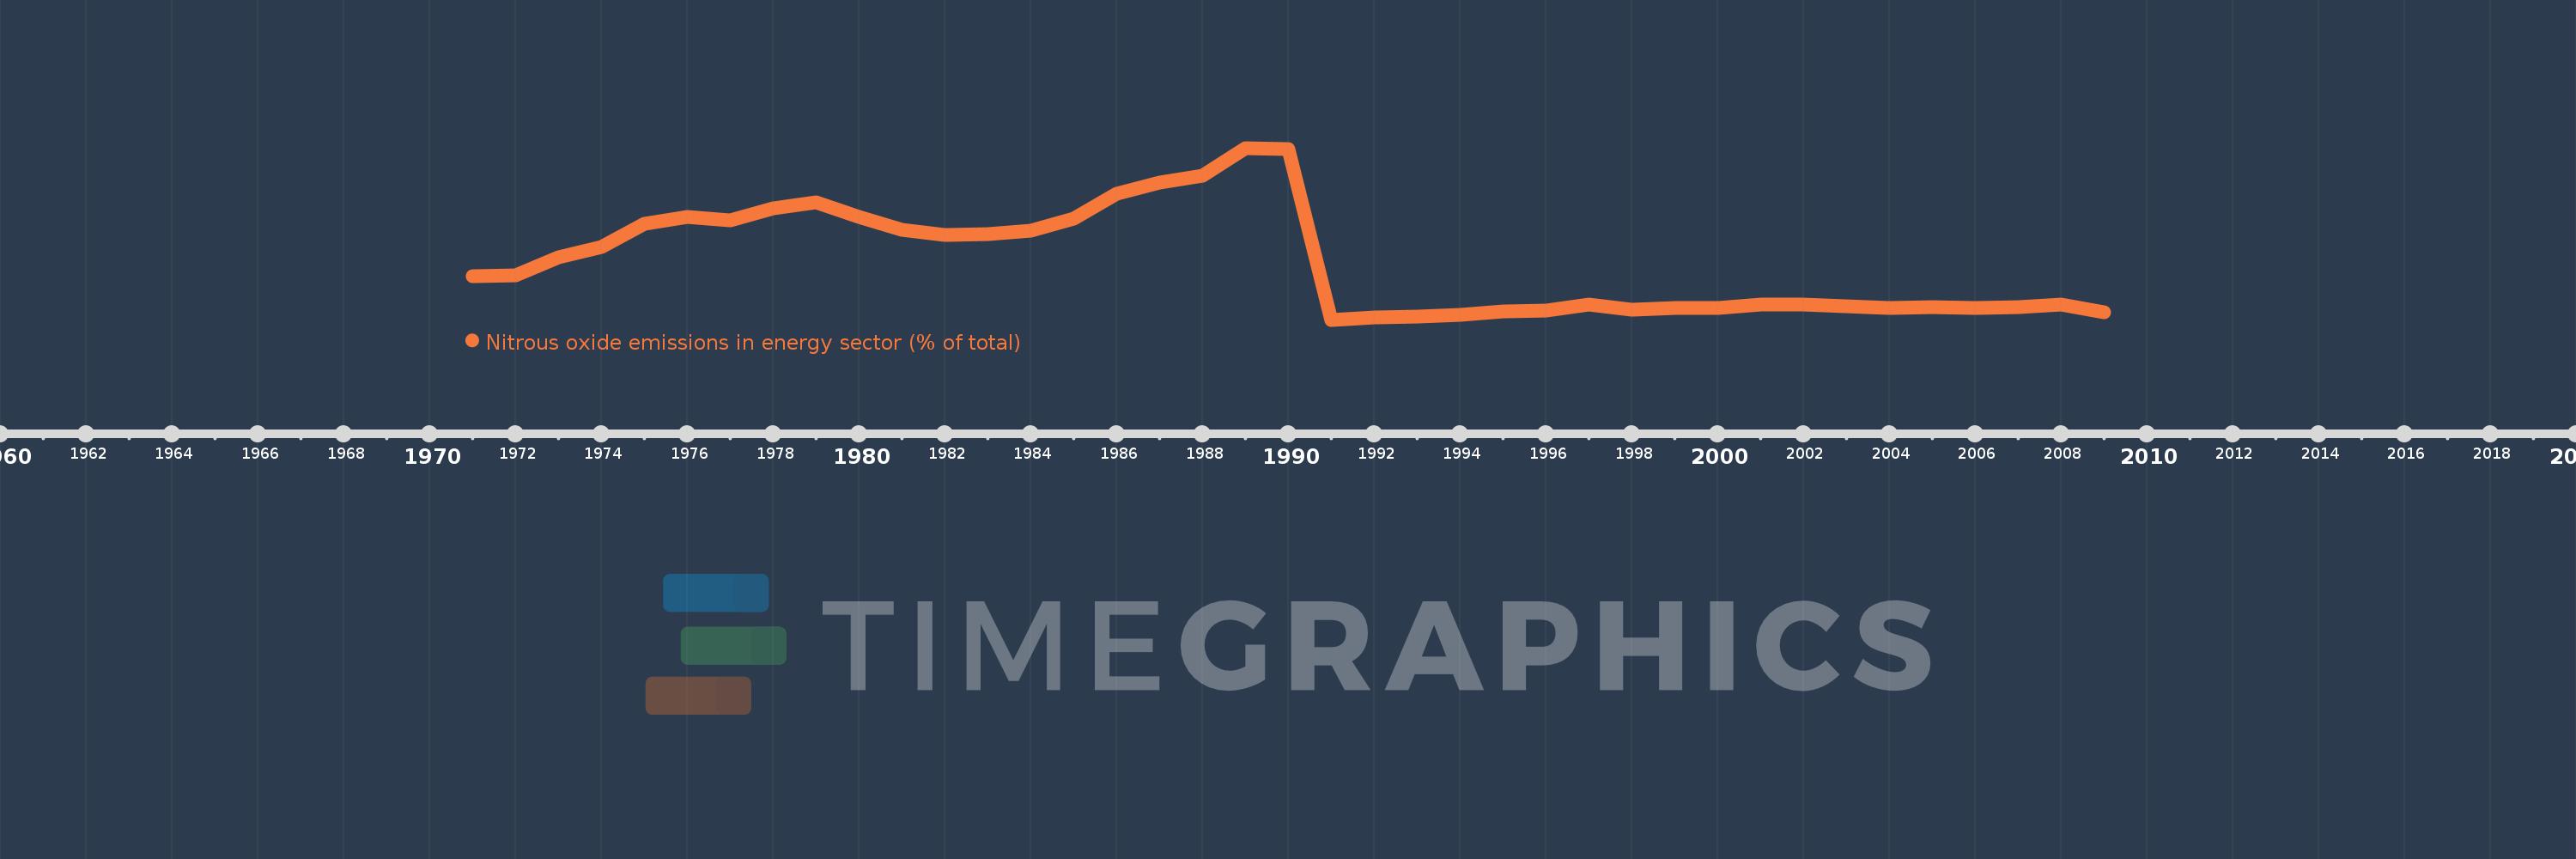
Nitrous oxide emissions in energy sector (% of total)
2009,2008,2007,2006,2005,2004,2003,2002,2001,2000,1999,1998,1997,1996,1995,1994,1993,1992,1991,1990,1989,1988,1987,1986,1985,1984,1983,1982,1981,1980,1979,1978,1977,1976,1975,1974,1973,1972,1971
This statistics in other country:
AfghanistanAlbaniaAlgeriaAmerican SamoaAndorraAngolaAntigua and BarbudaArab WorldArgentinaArmeniaArubaAustraliaAustriaAzerbaijanBahamas, TheBahrainBangladeshBarbadosBelarusBelgiumBelizeBeninBermudaBhutanBoliviaBosnia and HerzegovinaBotswanaBrazilBritish Virgin IslandsBrunei DarussalamBulgariaBurkina FasoBurundiCabo VerdeCambodiaCameroonCanadaCaribbean small statesCayman IslandsCentral African RepublicCentral Europe and the BalticsChadChileChinaColombiaComorosCongo, Dem. Rep.Congo, Rep.Costa RicaCote d'IvoireCroatiaCubaCyprusCzech RepublicDenmarkDjiboutiDominicaDominican RepublicEarly-demographic dividendEast Asia & PacificEast Asia & Pacific (excluding high income)East Asia & Pacific (IDA & IBRD countries)EcuadorEgypt, Arab Rep.El SalvadorEquatorial GuineaEritreaEstoniaEthiopiaEuro areaEurope & Central AsiaEurope & Central Asia (excluding high income)Europe & Central Asia (IDA & IBRD countries)European UnionFaroe IslandsFijiFinlandFragile and conflict affected situationsFranceFrench PolynesiaGabonGambia, TheGeorgiaGermanyGhanaGibraltarGreeceGreenlandGrenadaGuamGuatemalaGuineaGuinea-BissauGuyanaHaitiHeavily indebted poor countries (HIPC)High incomeHondurasHong Kong SAR, ChinaHungaryIBRD onlyIcelandIDA & IBRD totalIDA blendIDA onlyIDA totalIndiaIndonesiaIran, Islamic Rep.IraqIrelandIsraelItalyJamaicaJapanJordanKazakhstanKenyaKiribatiKorea, Dem. People’s Rep.Korea, Rep.KuwaitKyrgyz RepublicLao PDRLate-demographic dividendLatin America & Caribbean Latin America & Caribbean (excluding high income)Latin America & the Caribbean (IDA & IBRD countries)LatviaLeast developed countries: UN classificationLebanonLesothoLiberiaLibyaLithuaniaLow & middle incomeLow incomeLower middle incomeLuxembourgMacao SAR, ChinaMacedonia, FYRMadagascarMalawiMalaysiaMaldivesMaliMaltaMarshall IslandsMauritaniaMauritiusMexicoMicronesia, Fed. Sts.Middle East & North AfricaMiddle East & North Africa (excluding high income)Middle East & North Africa (IDA & IBRD countries)Middle incomeMoldovaMongoliaMoroccoMozambiqueMyanmarNamibiaNauruNepalNetherlandsNew CaledoniaNew ZealandNicaraguaNigerNigeriaNorth AmericaNorthern Mariana IslandsNorwayOECD membersOmanOther small statesPacific island small statesPakistanPalauPanamaPapua New GuineaParaguayPeruPhilippinesPolandPortugalPost-demographic dividendPre-demographic dividendPuerto RicoQatarRomaniaRussian FederationRwandaSamoaSao Tome and PrincipeSaudi ArabiaSenegalSerbiaSeychellesSierra LeoneSingaporeSlovak RepublicSloveniaSmall statesSolomon IslandsSomaliaSouth AfricaSouth AsiaSouth Asia (IDA & IBRD)SpainSri LankaSt. Kitts and NevisSt. LuciaSt. Vincent and the GrenadinesSub-Saharan Africa Sub-Saharan Africa (excluding high income)Sub-Saharan Africa (IDA & IBRD countries)SudanSurinameSwazilandSwedenSwitzerlandSyrian Arab RepublicTajikistanTanzaniaThailandTimor-LesteTogoTongaTrinidad and TobagoTunisiaTurkeyTurkmenistanTurks and Caicos IslandsTuvaluUgandaUkraineUnited Arab EmiratesUnited KingdomUnited StatesUpper middle incomeUruguayUzbekistanVanuatuVenezuela, RBVietnamVirgin Islands (U.S.)WorldYemen, Rep.ZambiaZimbabwe Timeline:
This timeline shows a graph from 1971 to 2009 of Iceland. No data until 1970. Number of actual observations by date: 39.
Source name:
World Development Indicators
Source organization:
World Bank staff estimates from original source: European Commission, Joint Research Centre (JRC)/Netherlands Environmental Assessment Agency (PBL). Emission Database for Global Atmospheric Research (EDGAR): http://edgar.jrc.ec.europa.eu/.
Categories, topics:
Energy & Mining, Environment
Last updated:
apr 23, 2017
Indicators value changes by year
Maximum:
16.912
jan 1, 1989
At the date of observation
Value
Absolute change
Change from previous value
jan 1, 1972
6.871
+0.071
1.04%
jan 1, 1973
8.3
+1.43
20.81%
jan 1, 1974
9.107
+0.806
9.72%
jan 1, 1975
10.941
+1.834
20.13%
jan 1, 1976
11.461
+0.521
4.76%
jan 1, 1977
11.203
-0.258
-2.25%
jan 1, 1978
12.112
+0.909
8.11%
jan 1, 1979
12.635
+0.523
4.31%
jan 1, 1980
11.456
-1.179
-9.33%
jan 1, 1981
10.417
-1.039
-9.07%
jan 1, 1982
10.077
-0.34
-3.27%
jan 1, 1983
10.09
+0.013
0.13%
jan 1, 1984
10.353
+0.262
2.6%
jan 1, 1985
11.305
+0.952
9.2%
jan 1, 1986
13.267
+1.962
17.36%
jan 1, 1987
14.187
+0.921
6.94%
jan 1, 1988
14.697
+0.509
3.59%
jan 1, 1989
16.912
+2.215
15.07%
jan 1, 1990
16.85
-0.062
-0.37%
jan 1, 1991
3.351
-13.499
-80.11%
jan 1, 1992
3.528
+0.177
5.28%
jan 1, 1993
3.627
+0.099
2.8%
jan 1, 1994
3.708
+0.081
2.22%
jan 1, 1995
3.982
+0.274
7.39%
jan 1, 1996
4.108
+0.126
3.16%
jan 1, 1997
4.523
+0.415
10.11%
jan 1, 1998
4.176
-0.347
-7.67%
jan 1, 1999
4.308
+0.132
3.15%
jan 1, 2000
4.298
-0.01
-0.23%
jan 1, 2001
4.562
+0.264
6.15%
jan 1, 2002
4.531
-0.031
-0.67%
jan 1, 2003
4.409
-0.123
-2.71%
jan 1, 2004
4.308
-0.1
-2.27%
jan 1, 2005
4.358
+0.05
1.15%
jan 1, 2006
4.248
-0.11
-2.52%
jan 1, 2007
4.379
+0.131
3.09%
jan 1, 2008
4.538
+0.159
3.64%
jan 1, 2009
3.912
-0.626
-13.8%
Ranking of countries by current statistics by years


Comments: