29
/
en
AIzaSyAYiBZKx7MnpbEhh9jyipgxe19OcubqV5w
April 1, 2024
181464
Lithuania
LTU
true
2
1
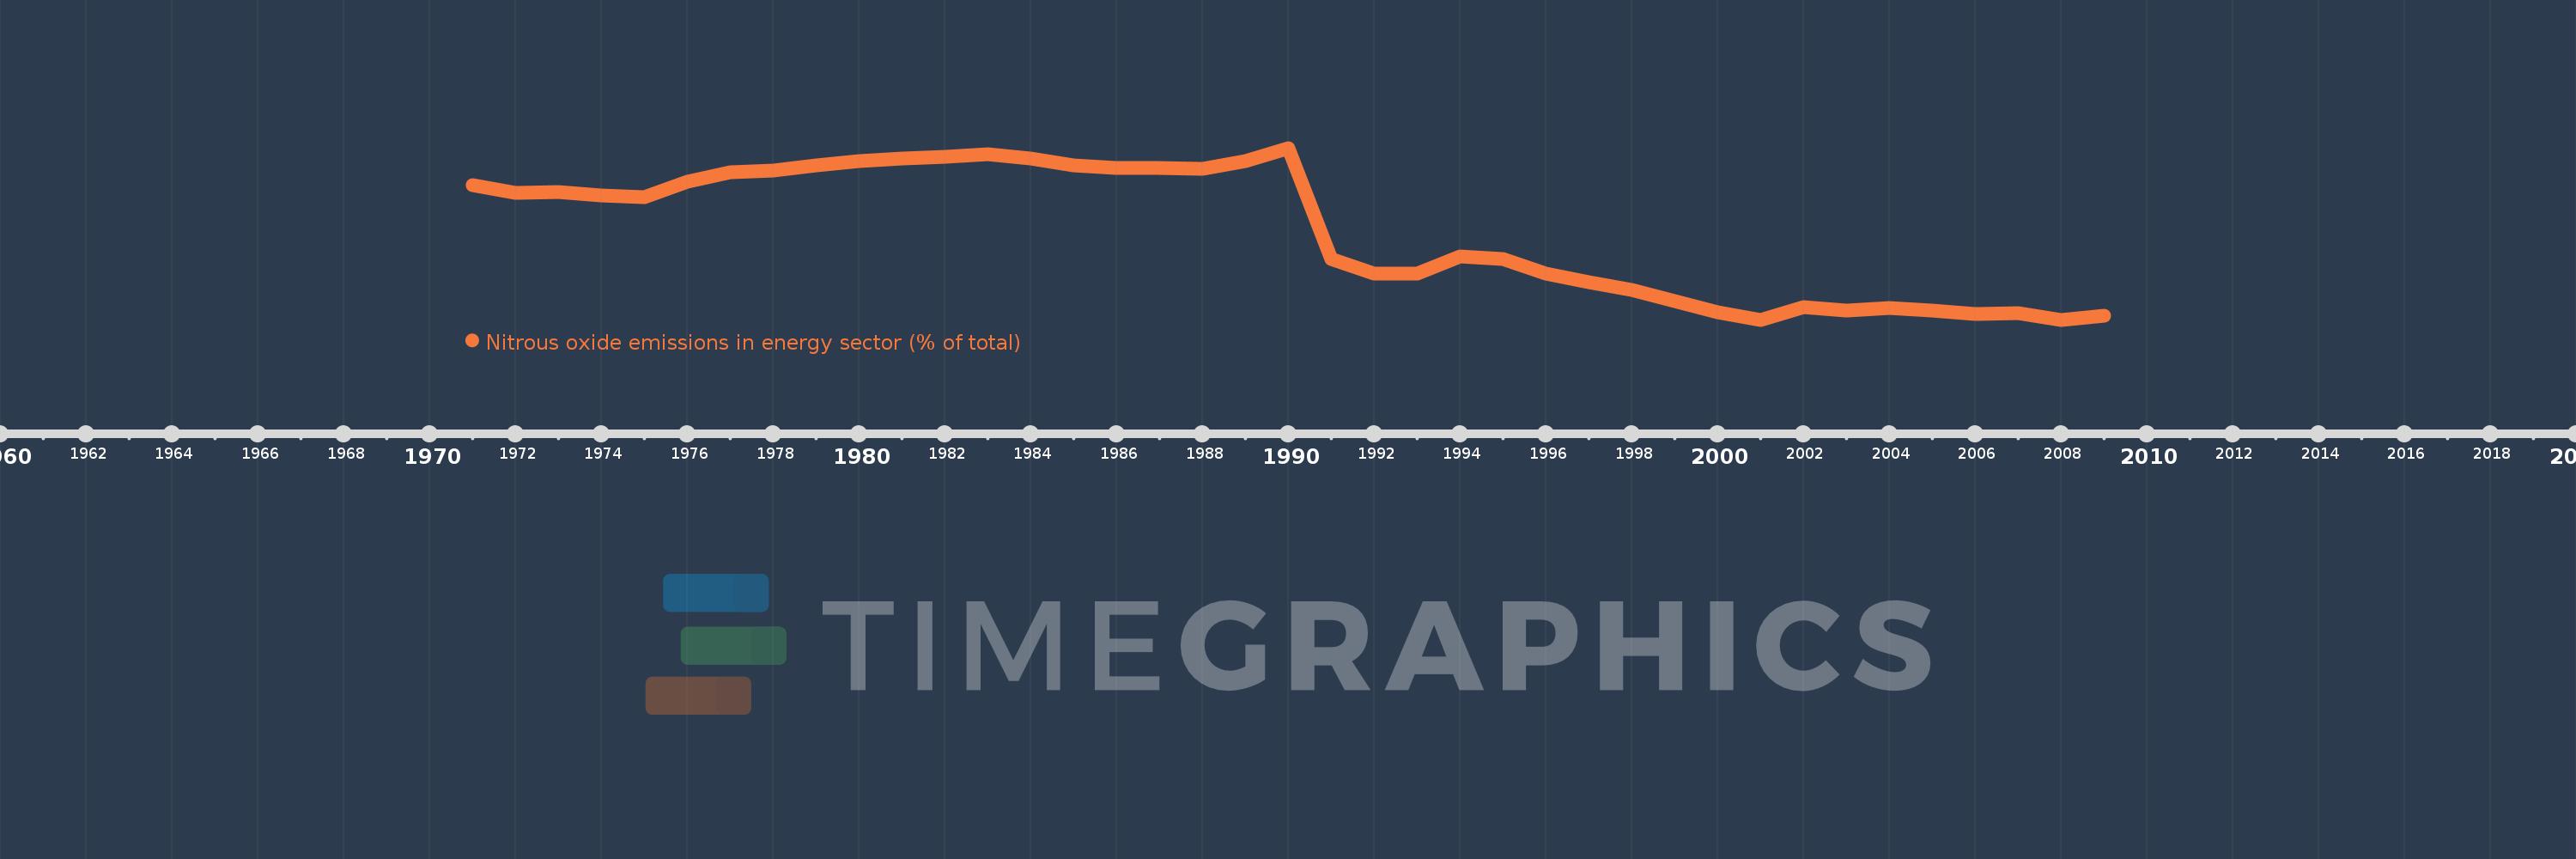
Nitrous oxide emissions in energy sector (% of total)
2009,2008,2007,2006,2005,2004,2003,2002,2001,2000,1999,1998,1997,1996,1995,1994,1993,1992,1991,1990,1989,1988,1987,1986,1985,1984,1983,1982,1981,1980,1979,1978,1977,1976,1975,1974,1973,1972,1971
This statistics in other country:
AfghanistanAlbaniaAlgeriaAmerican SamoaAndorraAngolaAntigua and BarbudaArab WorldArgentinaArmeniaArubaAustraliaAustriaAzerbaijanBahamas, TheBahrainBangladeshBarbadosBelarusBelgiumBelizeBeninBermudaBhutanBoliviaBosnia and HerzegovinaBotswanaBrazilBritish Virgin IslandsBrunei DarussalamBulgariaBurkina FasoBurundiCabo VerdeCambodiaCameroonCanadaCaribbean small statesCayman IslandsCentral African RepublicCentral Europe and the BalticsChadChileChinaColombiaComorosCongo, Dem. Rep.Congo, Rep.Costa RicaCote d'IvoireCroatiaCubaCyprusCzech RepublicDenmarkDjiboutiDominicaDominican RepublicEarly-demographic dividendEast Asia & PacificEast Asia & Pacific (excluding high income)East Asia & Pacific (IDA & IBRD countries)EcuadorEgypt, Arab Rep.El SalvadorEquatorial GuineaEritreaEstoniaEthiopiaEuro areaEurope & Central AsiaEurope & Central Asia (excluding high income)Europe & Central Asia (IDA & IBRD countries)European UnionFaroe IslandsFijiFinlandFragile and conflict affected situationsFranceFrench PolynesiaGabonGambia, TheGeorgiaGermanyGhanaGibraltarGreeceGreenlandGrenadaGuamGuatemalaGuineaGuinea-BissauGuyanaHaitiHeavily indebted poor countries (HIPC)High incomeHondurasHong Kong SAR, ChinaHungaryIBRD onlyIcelandIDA & IBRD totalIDA blendIDA onlyIDA totalIndiaIndonesiaIran, Islamic Rep.IraqIrelandIsraelItalyJamaicaJapanJordanKazakhstanKenyaKiribatiKorea, Dem. People’s Rep.Korea, Rep.KuwaitKyrgyz RepublicLao PDRLate-demographic dividendLatin America & Caribbean Latin America & Caribbean (excluding high income)Latin America & the Caribbean (IDA & IBRD countries)LatviaLeast developed countries: UN classificationLebanonLesothoLiberiaLibyaLithuaniaLow & middle incomeLow incomeLower middle incomeLuxembourgMacao SAR, ChinaMacedonia, FYRMadagascarMalawiMalaysiaMaldivesMaliMaltaMarshall IslandsMauritaniaMauritiusMexicoMicronesia, Fed. Sts.Middle East & North AfricaMiddle East & North Africa (excluding high income)Middle East & North Africa (IDA & IBRD countries)Middle incomeMoldovaMongoliaMoroccoMozambiqueMyanmarNamibiaNauruNepalNetherlandsNew CaledoniaNew ZealandNicaraguaNigerNigeriaNorth AmericaNorthern Mariana IslandsNorwayOECD membersOmanOther small statesPacific island small statesPakistanPalauPanamaPapua New GuineaParaguayPeruPhilippinesPolandPortugalPost-demographic dividendPre-demographic dividendPuerto RicoQatarRomaniaRussian FederationRwandaSamoaSao Tome and PrincipeSaudi ArabiaSenegalSerbiaSeychellesSierra LeoneSingaporeSlovak RepublicSloveniaSmall statesSolomon IslandsSomaliaSouth AfricaSouth AsiaSouth Asia (IDA & IBRD)SpainSri LankaSt. Kitts and NevisSt. LuciaSt. Vincent and the GrenadinesSub-Saharan Africa Sub-Saharan Africa (excluding high income)Sub-Saharan Africa (IDA & IBRD countries)SudanSurinameSwazilandSwedenSwitzerlandSyrian Arab RepublicTajikistanTanzaniaThailandTimor-LesteTogoTongaTrinidad and TobagoTunisiaTurkeyTurkmenistanTurks and Caicos IslandsTuvaluUgandaUkraineUnited Arab EmiratesUnited KingdomUnited StatesUpper middle incomeUruguayUzbekistanVanuatuVenezuela, RBVietnamVirgin Islands (U.S.)WorldYemen, Rep.ZambiaZimbabwe Timeline:
This timeline shows a graph from 1971 to 2009 of Lithuania. No data until 1970. Number of actual observations by date: 39.
Source name:
World Development Indicators
Source organization:
World Bank staff estimates from original source: European Commission, Joint Research Centre (JRC)/Netherlands Environmental Assessment Agency (PBL). Emission Database for Global Atmospheric Research (EDGAR): http://edgar.jrc.ec.europa.eu/.
Categories, topics:
Energy & Mining, Environment
Last updated:
apr 23, 2017
Indicators value changes by year
At the date of observation
Value
Absolute change
Change from previous value
jan 1, 1971
7.671
+7.671
0.0%
jan 1, 1972
7.367
-0.304
-3.97%
jan 1, 1973
7.395
+0.028
0.38%
jan 1, 1974
7.282
-0.113
-1.52%
jan 1, 1975
7.194
-0.088
-1.21%
jan 1, 1976
7.822
+0.628
8.73%
jan 1, 1977
8.194
+0.372
4.75%
jan 1, 1978
8.28
+0.086
1.05%
jan 1, 1979
8.459
+0.18
2.17%
jan 1, 1980
8.646
+0.186
2.2%
jan 1, 1981
8.764
+0.118
1.37%
jan 1, 1982
8.805
+0.041
0.46%
jan 1, 1983
8.928
+0.124
1.41%
jan 1, 1984
8.759
-0.169
-1.9%
jan 1, 1985
8.458
-0.301
-3.44%
jan 1, 1986
8.356
-0.102
-1.21%
jan 1, 1987
8.36
+0.004
0.05%
jan 1, 1988
8.334
-0.026
-0.31%
jan 1, 1989
8.634
+0.3
3.6%
jan 1, 1990
9.171
+0.537
6.22%
jan 1, 1991
4.726
-4.446
-48.47%
jan 1, 1992
4.122
-0.604
-12.78%
jan 1, 1993
4.128
+0.006
0.14%
jan 1, 1994
4.819
+0.691
16.75%
jan 1, 1995
4.713
-0.106
-2.2%
jan 1, 1996
4.122
-0.591
-12.54%
jan 1, 1997
3.789
-0.333
-8.08%
jan 1, 1998
3.479
-0.31
-8.18%
jan 1, 1999
3.035
-0.444
-12.77%
jan 1, 2000
2.591
-0.444
-14.62%
jan 1, 2001
2.285
-0.306
-11.82%
jan 1, 2002
2.806
+0.521
22.82%
jan 1, 2003
2.657
-0.15
-5.33%
jan 1, 2004
2.741
+0.085
3.2%
jan 1, 2005
2.638
-0.103
-3.76%
jan 1, 2006
2.531
-0.107
-4.06%
jan 1, 2007
2.548
+0.017
0.67%
jan 1, 2008
2.29
-0.258
-10.14%
jan 1, 2009
2.453
+0.163
7.12%
Ranking of countries by current statistics by years


Comments: