29
/
en
AIzaSyAYiBZKx7MnpbEhh9jyipgxe19OcubqV5w
April 1, 2024
188212
Malaysia
MYS
true
2
1
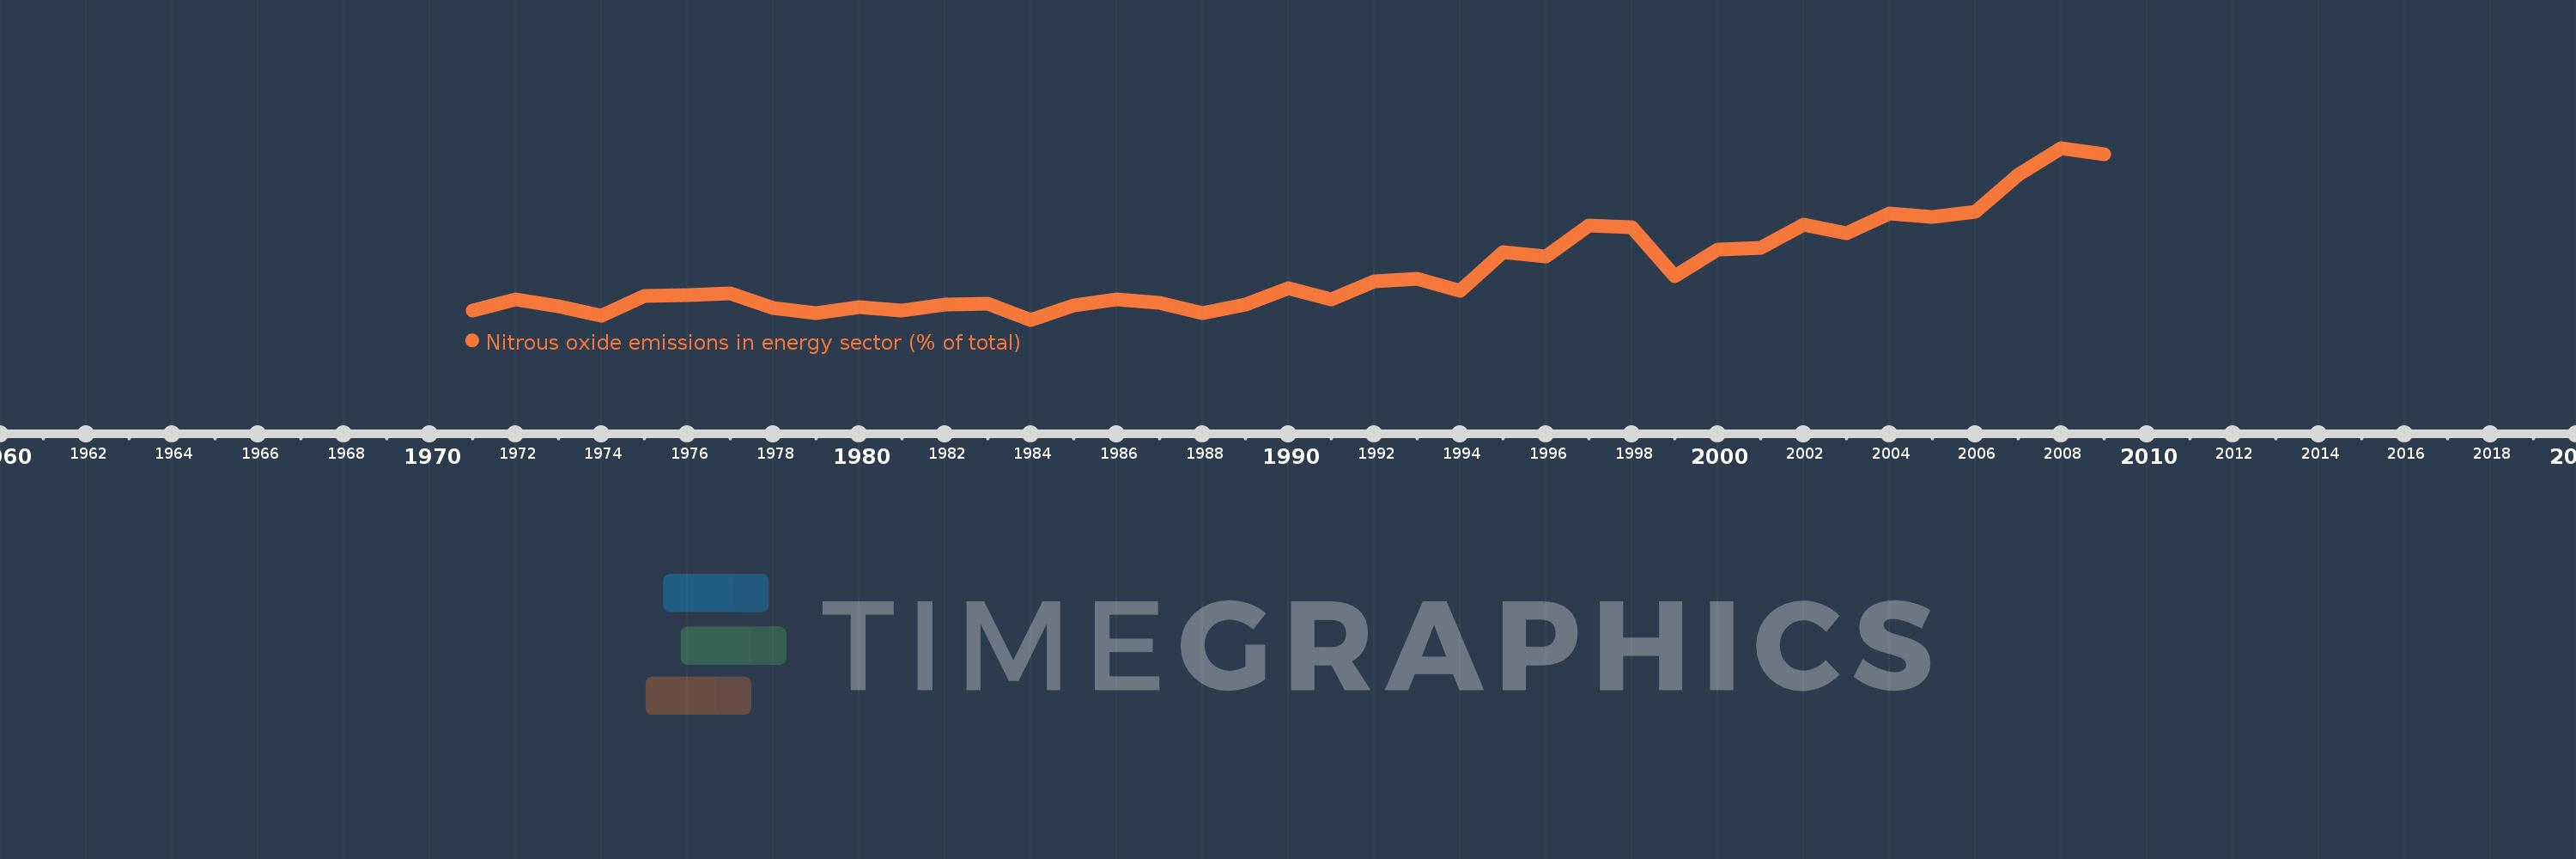
Nitrous oxide emissions in energy sector (% of total)
2009,2008,2007,2006,2005,2004,2003,2002,2001,2000,1999,1998,1997,1996,1995,1994,1993,1992,1991,1990,1989,1988,1987,1986,1985,1984,1983,1982,1981,1980,1979,1978,1977,1976,1975,1974,1973,1972,1971
This statistics in other country:
AfghanistanAlbaniaAlgeriaAmerican SamoaAndorraAngolaAntigua and BarbudaArab WorldArgentinaArmeniaArubaAustraliaAustriaAzerbaijanBahamas, TheBahrainBangladeshBarbadosBelarusBelgiumBelizeBeninBermudaBhutanBoliviaBosnia and HerzegovinaBotswanaBrazilBritish Virgin IslandsBrunei DarussalamBulgariaBurkina FasoBurundiCabo VerdeCambodiaCameroonCanadaCaribbean small statesCayman IslandsCentral African RepublicCentral Europe and the BalticsChadChileChinaColombiaComorosCongo, Dem. Rep.Congo, Rep.Costa RicaCote d'IvoireCroatiaCubaCyprusCzech RepublicDenmarkDjiboutiDominicaDominican RepublicEarly-demographic dividendEast Asia & PacificEast Asia & Pacific (excluding high income)East Asia & Pacific (IDA & IBRD countries)EcuadorEgypt, Arab Rep.El SalvadorEquatorial GuineaEritreaEstoniaEthiopiaEuro areaEurope & Central AsiaEurope & Central Asia (excluding high income)Europe & Central Asia (IDA & IBRD countries)European UnionFaroe IslandsFijiFinlandFragile and conflict affected situationsFranceFrench PolynesiaGabonGambia, TheGeorgiaGermanyGhanaGibraltarGreeceGreenlandGrenadaGuamGuatemalaGuineaGuinea-BissauGuyanaHaitiHeavily indebted poor countries (HIPC)High incomeHondurasHong Kong SAR, ChinaHungaryIBRD onlyIcelandIDA & IBRD totalIDA blendIDA onlyIDA totalIndiaIndonesiaIran, Islamic Rep.IraqIrelandIsraelItalyJamaicaJapanJordanKazakhstanKenyaKiribatiKorea, Dem. People’s Rep.Korea, Rep.KuwaitKyrgyz RepublicLao PDRLate-demographic dividendLatin America & Caribbean Latin America & Caribbean (excluding high income)Latin America & the Caribbean (IDA & IBRD countries)LatviaLeast developed countries: UN classificationLebanonLesothoLiberiaLibyaLithuaniaLow & middle incomeLow incomeLower middle incomeLuxembourgMacao SAR, ChinaMacedonia, FYRMadagascarMalawiMalaysiaMaldivesMaliMaltaMarshall IslandsMauritaniaMauritiusMexicoMicronesia, Fed. Sts.Middle East & North AfricaMiddle East & North Africa (excluding high income)Middle East & North Africa (IDA & IBRD countries)Middle incomeMoldovaMongoliaMoroccoMozambiqueMyanmarNamibiaNauruNepalNetherlandsNew CaledoniaNew ZealandNicaraguaNigerNigeriaNorth AmericaNorthern Mariana IslandsNorwayOECD membersOmanOther small statesPacific island small statesPakistanPalauPanamaPapua New GuineaParaguayPeruPhilippinesPolandPortugalPost-demographic dividendPre-demographic dividendPuerto RicoQatarRomaniaRussian FederationRwandaSamoaSao Tome and PrincipeSaudi ArabiaSenegalSerbiaSeychellesSierra LeoneSingaporeSlovak RepublicSloveniaSmall statesSolomon IslandsSomaliaSouth AfricaSouth AsiaSouth Asia (IDA & IBRD)SpainSri LankaSt. Kitts and NevisSt. LuciaSt. Vincent and the GrenadinesSub-Saharan Africa Sub-Saharan Africa (excluding high income)Sub-Saharan Africa (IDA & IBRD countries)SudanSurinameSwazilandSwedenSwitzerlandSyrian Arab RepublicTajikistanTanzaniaThailandTimor-LesteTogoTongaTrinidad and TobagoTunisiaTurkeyTurkmenistanTurks and Caicos IslandsTuvaluUgandaUkraineUnited Arab EmiratesUnited KingdomUnited StatesUpper middle incomeUruguayUzbekistanVanuatuVenezuela, RBVietnamVirgin Islands (U.S.)WorldYemen, Rep.ZambiaZimbabwe Timeline:
This timeline shows a graph from 1971 to 2009 of Malaysia. No data until 1970. Number of actual observations by date: 39.
Source name:
World Development Indicators
Source organization:
World Bank staff estimates from original source: European Commission, Joint Research Centre (JRC)/Netherlands Environmental Assessment Agency (PBL). Emission Database for Global Atmospheric Research (EDGAR): http://edgar.jrc.ec.europa.eu/.
Categories, topics:
Energy & Mining, Environment
Last updated:
apr 23, 2017
Indicators value changes by year
At the date of observation
Value
Absolute change
Change from previous value
jan 1, 1971
1.522
+1.522
0.0%
jan 1, 1972
1.883
+0.361
23.7%
jan 1, 1973
1.672
-0.211
-11.22%
jan 1, 1974
1.365
-0.307
-18.34%
jan 1, 1975
1.979
+0.613
44.92%
jan 1, 1976
2.022
+0.044
2.21%
jan 1, 1977
2.064
+0.042
2.08%
jan 1, 1978
1.623
-0.441
-21.39%
jan 1, 1979
1.448
-0.175
-10.8%
jan 1, 1980
1.651
+0.203
14.02%
jan 1, 1981
1.545
-0.106
-6.42%
jan 1, 1982
1.717
+0.172
11.14%
jan 1, 1983
1.746
+0.029
1.68%
jan 1, 1984
1.247
-0.498
-28.55%
jan 1, 1985
1.708
+0.46
36.89%
jan 1, 1986
1.895
+0.188
11.0%
jan 1, 1987
1.77
-0.126
-6.64%
jan 1, 1988
1.456
-0.314
-17.75%
jan 1, 1989
1.735
+0.279
19.17%
jan 1, 1990
2.226
+0.492
28.36%
jan 1, 1991
1.892
-0.334
-15.0%
jan 1, 1992
2.447
+0.554
29.29%
jan 1, 1993
2.535
+0.088
3.61%
jan 1, 1994
2.155
-0.38
-14.99%
jan 1, 1995
3.368
+1.213
56.28%
jan 1, 1996
3.234
-0.134
-3.97%
jan 1, 1997
4.184
+0.95
29.37%
jan 1, 1998
4.133
-0.051
-1.22%
jan 1, 1999
2.612
-1.521
-36.8%
jan 1, 2000
3.444
+0.832
31.84%
jan 1, 2001
3.5
+0.056
1.62%
jan 1, 2002
4.204
+0.704
20.11%
jan 1, 2003
3.943
-0.26
-6.19%
jan 1, 2004
4.554
+0.61
15.48%
jan 1, 2005
4.447
-0.107
-2.35%
jan 1, 2006
4.606
+0.16
3.59%
jan 1, 2007
5.772
+1.165
25.3%
jan 1, 2008
6.61
+0.839
14.53%
jan 1, 2009
6.404
-0.206
-3.11%
Ranking of countries by current statistics by years


Comments: