29
/
en
AIzaSyAYiBZKx7MnpbEhh9jyipgxe19OcubqV5w
April 1, 2024
249162
Sri Lanka
LKA
true
2
1
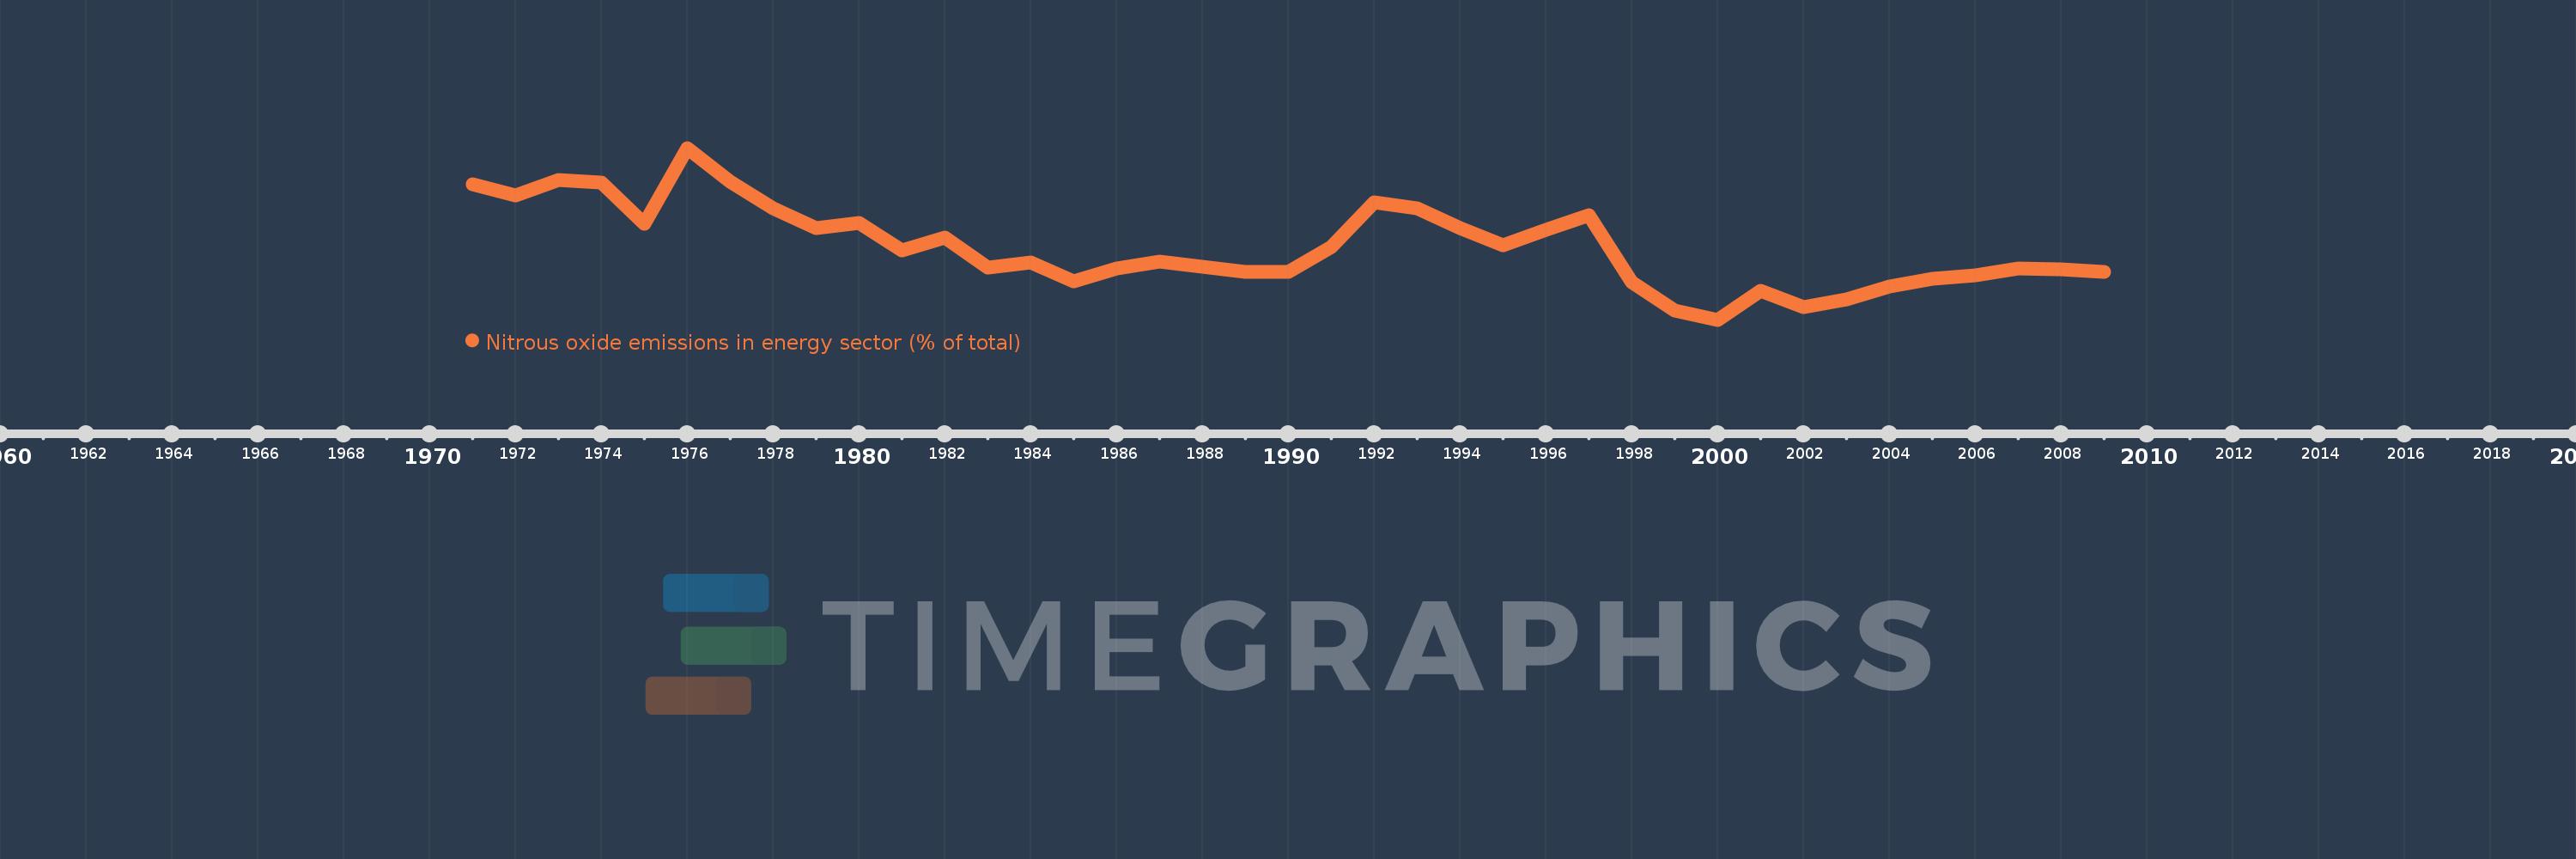
Nitrous oxide emissions in energy sector (% of total)
2009,2008,2007,2006,2005,2004,2003,2002,2001,2000,1999,1998,1997,1996,1995,1994,1993,1992,1991,1990,1989,1988,1987,1986,1985,1984,1983,1982,1981,1980,1979,1978,1977,1976,1975,1974,1973,1972,1971
This statistics in other country:
AfghanistanAlbaniaAlgeriaAmerican SamoaAndorraAngolaAntigua and BarbudaArab WorldArgentinaArmeniaArubaAustraliaAustriaAzerbaijanBahamas, TheBahrainBangladeshBarbadosBelarusBelgiumBelizeBeninBermudaBhutanBoliviaBosnia and HerzegovinaBotswanaBrazilBritish Virgin IslandsBrunei DarussalamBulgariaBurkina FasoBurundiCabo VerdeCambodiaCameroonCanadaCaribbean small statesCayman IslandsCentral African RepublicCentral Europe and the BalticsChadChileChinaColombiaComorosCongo, Dem. Rep.Congo, Rep.Costa RicaCote d'IvoireCroatiaCubaCyprusCzech RepublicDenmarkDjiboutiDominicaDominican RepublicEarly-demographic dividendEast Asia & PacificEast Asia & Pacific (excluding high income)East Asia & Pacific (IDA & IBRD countries)EcuadorEgypt, Arab Rep.El SalvadorEquatorial GuineaEritreaEstoniaEthiopiaEuro areaEurope & Central AsiaEurope & Central Asia (excluding high income)Europe & Central Asia (IDA & IBRD countries)European UnionFaroe IslandsFijiFinlandFragile and conflict affected situationsFranceFrench PolynesiaGabonGambia, TheGeorgiaGermanyGhanaGibraltarGreeceGreenlandGrenadaGuamGuatemalaGuineaGuinea-BissauGuyanaHaitiHeavily indebted poor countries (HIPC)High incomeHondurasHong Kong SAR, ChinaHungaryIBRD onlyIcelandIDA & IBRD totalIDA blendIDA onlyIDA totalIndiaIndonesiaIran, Islamic Rep.IraqIrelandIsraelItalyJamaicaJapanJordanKazakhstanKenyaKiribatiKorea, Dem. People’s Rep.Korea, Rep.KuwaitKyrgyz RepublicLao PDRLate-demographic dividendLatin America & Caribbean Latin America & Caribbean (excluding high income)Latin America & the Caribbean (IDA & IBRD countries)LatviaLeast developed countries: UN classificationLebanonLesothoLiberiaLibyaLithuaniaLow & middle incomeLow incomeLower middle incomeLuxembourgMacao SAR, ChinaMacedonia, FYRMadagascarMalawiMalaysiaMaldivesMaliMaltaMarshall IslandsMauritaniaMauritiusMexicoMicronesia, Fed. Sts.Middle East & North AfricaMiddle East & North Africa (excluding high income)Middle East & North Africa (IDA & IBRD countries)Middle incomeMoldovaMongoliaMoroccoMozambiqueMyanmarNamibiaNauruNepalNetherlandsNew CaledoniaNew ZealandNicaraguaNigerNigeriaNorth AmericaNorthern Mariana IslandsNorwayOECD membersOmanOther small statesPacific island small statesPakistanPalauPanamaPapua New GuineaParaguayPeruPhilippinesPolandPortugalPost-demographic dividendPre-demographic dividendPuerto RicoQatarRomaniaRussian FederationRwandaSamoaSao Tome and PrincipeSaudi ArabiaSenegalSerbiaSeychellesSierra LeoneSingaporeSlovak RepublicSloveniaSmall statesSolomon IslandsSomaliaSouth AfricaSouth AsiaSouth Asia (IDA & IBRD)SpainSri LankaSt. Kitts and NevisSt. LuciaSt. Vincent and the GrenadinesSub-Saharan Africa Sub-Saharan Africa (excluding high income)Sub-Saharan Africa (IDA & IBRD countries)SudanSurinameSwazilandSwedenSwitzerlandSyrian Arab RepublicTajikistanTanzaniaThailandTimor-LesteTogoTongaTrinidad and TobagoTunisiaTurkeyTurkmenistanTurks and Caicos IslandsTuvaluUgandaUkraineUnited Arab EmiratesUnited KingdomUnited StatesUpper middle incomeUruguayUzbekistanVanuatuVenezuela, RBVietnamVirgin Islands (U.S.)WorldYemen, Rep.ZambiaZimbabwe Timeline:
This timeline shows a graph from 1971 to 2009 of Sri Lanka. No data until 1970. Number of actual observations by date: 39.
Source name:
World Development Indicators
Source organization:
World Bank staff estimates from original source: European Commission, Joint Research Centre (JRC)/Netherlands Environmental Assessment Agency (PBL). Emission Database for Global Atmospheric Research (EDGAR): http://edgar.jrc.ec.europa.eu/.
Categories, topics:
Energy & Mining, Environment
Last updated:
apr 23, 2017
Indicators value changes by year
Minimum:
11.381
jan 1, 2000
Maximum:
17.581
jan 1, 1976
At the date of observation
Value
Absolute change
Change from previous value
jan 1, 1971
16.258
+16.258
0.0%
jan 1, 1972
15.882
-0.375
-2.31%
jan 1, 1973
16.415
+0.533
3.36%
jan 1, 1974
16.337
-0.078
-0.48%
jan 1, 1975
14.834
-1.503
-9.2%
jan 1, 1976
17.581
+2.747
18.52%
jan 1, 1977
16.372
-1.208
-6.87%
jan 1, 1978
15.391
-0.982
-6.0%
jan 1, 1979
14.687
-0.704
-4.58%
jan 1, 1980
14.864
+0.177
1.21%
jan 1, 1981
13.871
-0.993
-6.68%
jan 1, 1982
14.355
+0.484
3.49%
jan 1, 1983
13.248
-1.107
-7.71%
jan 1, 1984
13.441
+0.192
1.45%
jan 1, 1985
12.754
-0.686
-5.1%
jan 1, 1986
13.225
+0.47
3.69%
jan 1, 1987
13.492
+0.267
2.02%
jan 1, 1988
13.298
-0.193
-1.43%
jan 1, 1989
13.123
-0.176
-1.32%
jan 1, 1990
13.109
-0.013
-0.1%
jan 1, 1991
14.002
+0.892
6.81%
jan 1, 1992
15.614
+1.612
11.52%
jan 1, 1993
15.404
-0.209
-1.34%
jan 1, 1994
14.697
-0.707
-4.59%
jan 1, 1995
14.069
-0.629
-4.28%
jan 1, 1996
14.616
+0.547
3.89%
jan 1, 1997
15.146
+0.53
3.63%
jan 1, 1998
12.749
-2.397
-15.83%
jan 1, 1999
11.713
-1.036
-8.13%
jan 1, 2000
11.381
-0.332
-2.84%
jan 1, 2001
12.425
+1.044
9.18%
jan 1, 2002
11.85
-0.575
-4.63%
jan 1, 2003
12.127
+0.277
2.34%
jan 1, 2004
12.588
+0.462
3.81%
jan 1, 2005
12.855
+0.266
2.12%
jan 1, 2006
12.981
+0.126
0.98%
jan 1, 2007
13.226
+0.244
1.88%
jan 1, 2008
13.211
-0.014
-0.11%
jan 1, 2009
13.093
-0.119
-0.9%
Ranking of countries by current statistics by years


Comments: