29
/
en
AIzaSyAYiBZKx7MnpbEhh9jyipgxe19OcubqV5w
April 1, 2024
208893
New Caledonia
NCL
true
2
1
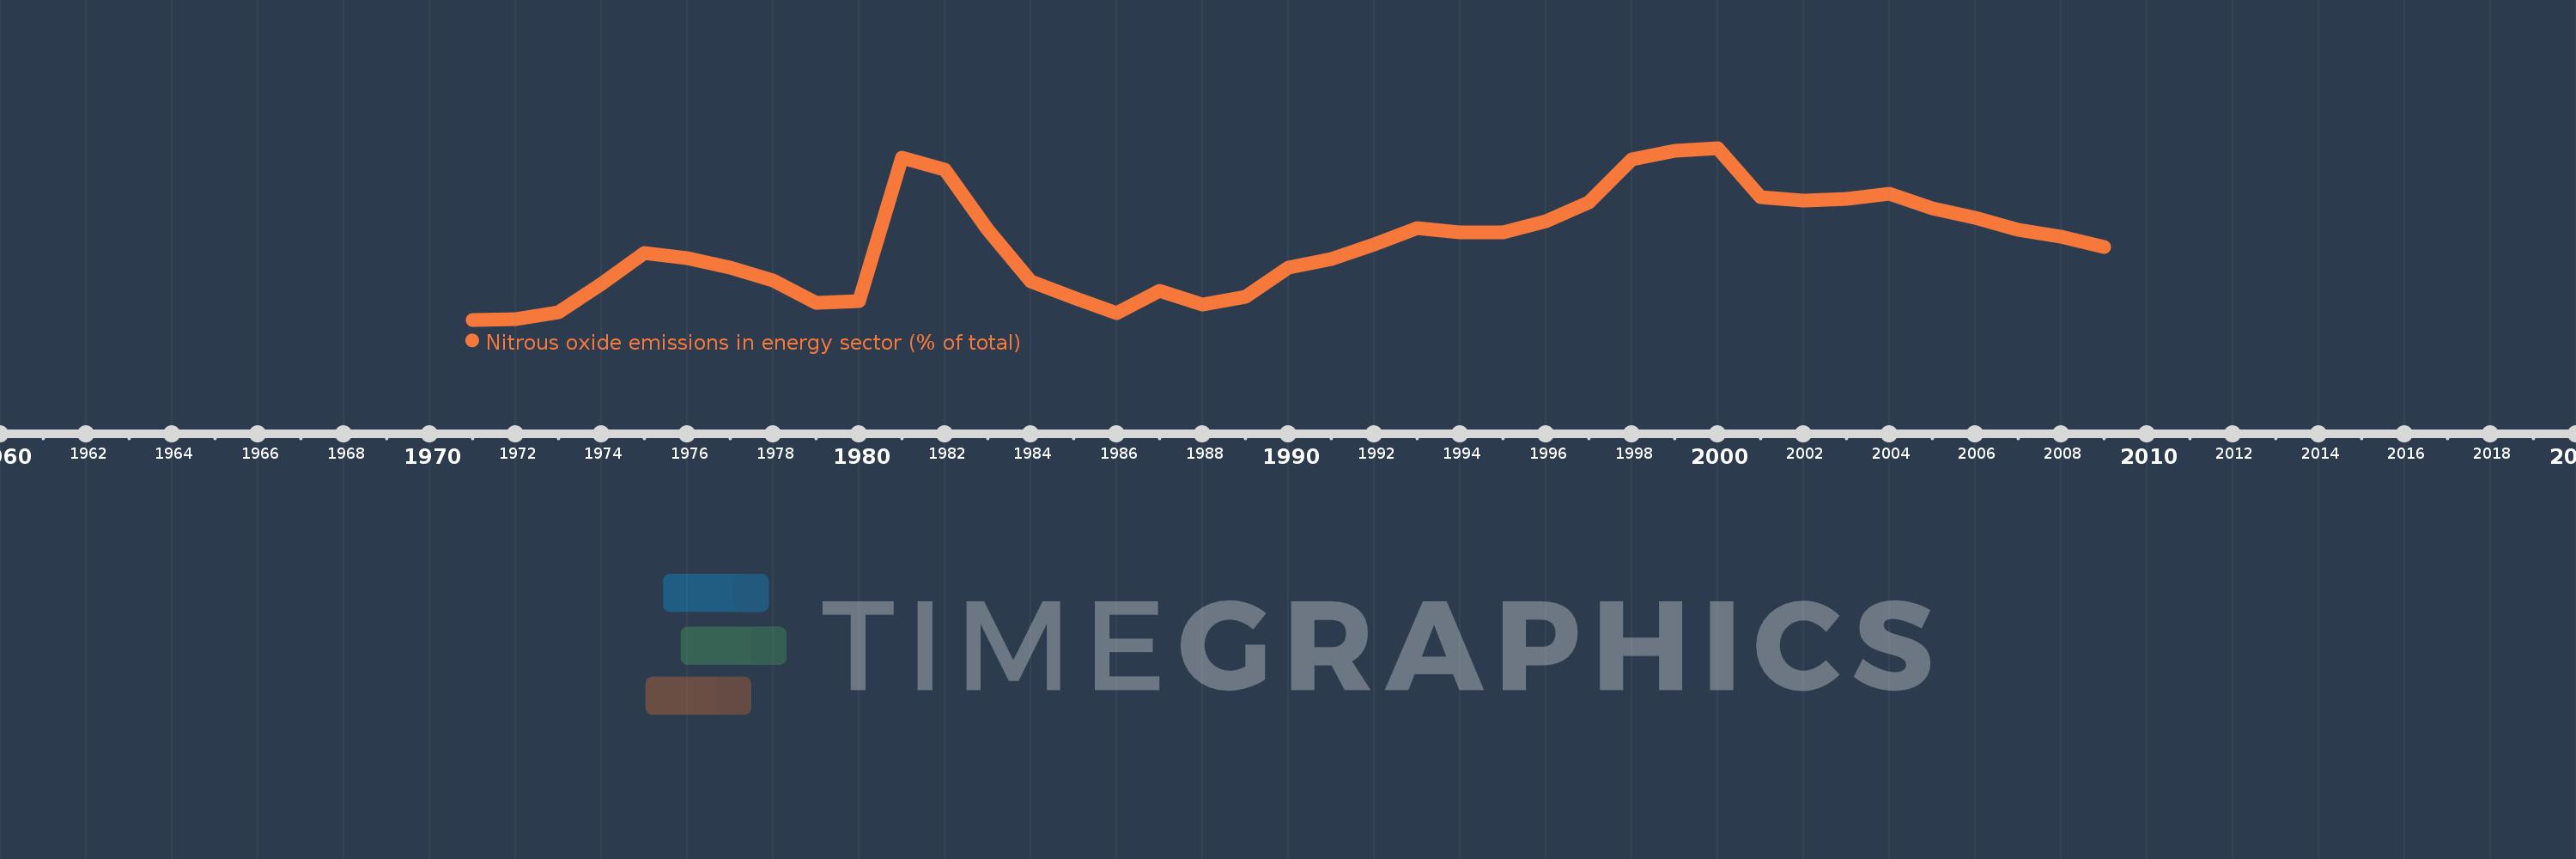
Nitrous oxide emissions in energy sector (% of total)
2009,2008,2007,2006,2005,2004,2003,2002,2001,2000,1999,1998,1997,1996,1995,1994,1993,1992,1991,1990,1989,1988,1987,1986,1985,1984,1983,1982,1981,1980,1979,1978,1977,1976,1975,1974,1973,1972,1971
This statistics in other country:
AfghanistanAlbaniaAlgeriaAmerican SamoaAndorraAngolaAntigua and BarbudaArab WorldArgentinaArmeniaArubaAustraliaAustriaAzerbaijanBahamas, TheBahrainBangladeshBarbadosBelarusBelgiumBelizeBeninBermudaBhutanBoliviaBosnia and HerzegovinaBotswanaBrazilBritish Virgin IslandsBrunei DarussalamBulgariaBurkina FasoBurundiCabo VerdeCambodiaCameroonCanadaCaribbean small statesCayman IslandsCentral African RepublicCentral Europe and the BalticsChadChileChinaColombiaComorosCongo, Dem. Rep.Congo, Rep.Costa RicaCote d'IvoireCroatiaCubaCyprusCzech RepublicDenmarkDjiboutiDominicaDominican RepublicEarly-demographic dividendEast Asia & PacificEast Asia & Pacific (excluding high income)East Asia & Pacific (IDA & IBRD countries)EcuadorEgypt, Arab Rep.El SalvadorEquatorial GuineaEritreaEstoniaEthiopiaEuro areaEurope & Central AsiaEurope & Central Asia (excluding high income)Europe & Central Asia (IDA & IBRD countries)European UnionFaroe IslandsFijiFinlandFragile and conflict affected situationsFranceFrench PolynesiaGabonGambia, TheGeorgiaGermanyGhanaGibraltarGreeceGreenlandGrenadaGuamGuatemalaGuineaGuinea-BissauGuyanaHaitiHeavily indebted poor countries (HIPC)High incomeHondurasHong Kong SAR, ChinaHungaryIBRD onlyIcelandIDA & IBRD totalIDA blendIDA onlyIDA totalIndiaIndonesiaIran, Islamic Rep.IraqIrelandIsraelItalyJamaicaJapanJordanKazakhstanKenyaKiribatiKorea, Dem. People’s Rep.Korea, Rep.KuwaitKyrgyz RepublicLao PDRLate-demographic dividendLatin America & Caribbean Latin America & Caribbean (excluding high income)Latin America & the Caribbean (IDA & IBRD countries)LatviaLeast developed countries: UN classificationLebanonLesothoLiberiaLibyaLithuaniaLow & middle incomeLow incomeLower middle incomeLuxembourgMacao SAR, ChinaMacedonia, FYRMadagascarMalawiMalaysiaMaldivesMaliMaltaMarshall IslandsMauritaniaMauritiusMexicoMicronesia, Fed. Sts.Middle East & North AfricaMiddle East & North Africa (excluding high income)Middle East & North Africa (IDA & IBRD countries)Middle incomeMoldovaMongoliaMoroccoMozambiqueMyanmarNamibiaNauruNepalNetherlandsNew CaledoniaNew ZealandNicaraguaNigerNigeriaNorth AmericaNorthern Mariana IslandsNorwayOECD membersOmanOther small statesPacific island small statesPakistanPalauPanamaPapua New GuineaParaguayPeruPhilippinesPolandPortugalPost-demographic dividendPre-demographic dividendPuerto RicoQatarRomaniaRussian FederationRwandaSamoaSao Tome and PrincipeSaudi ArabiaSenegalSerbiaSeychellesSierra LeoneSingaporeSlovak RepublicSloveniaSmall statesSolomon IslandsSomaliaSouth AfricaSouth AsiaSouth Asia (IDA & IBRD)SpainSri LankaSt. Kitts and NevisSt. LuciaSt. Vincent and the GrenadinesSub-Saharan Africa Sub-Saharan Africa (excluding high income)Sub-Saharan Africa (IDA & IBRD countries)SudanSurinameSwazilandSwedenSwitzerlandSyrian Arab RepublicTajikistanTanzaniaThailandTimor-LesteTogoTongaTrinidad and TobagoTunisiaTurkeyTurkmenistanTurks and Caicos IslandsTuvaluUgandaUkraineUnited Arab EmiratesUnited KingdomUnited StatesUpper middle incomeUruguayUzbekistanVanuatuVenezuela, RBVietnamVirgin Islands (U.S.)WorldYemen, Rep.ZambiaZimbabwe Timeline:
This timeline shows a graph from 1971 to 2009 of New Caledonia. No data until 1970. Number of actual observations by date: 39.
Source name:
World Development Indicators
Source organization:
World Bank staff estimates from original source: European Commission, Joint Research Centre (JRC)/Netherlands Environmental Assessment Agency (PBL). Emission Database for Global Atmospheric Research (EDGAR): http://edgar.jrc.ec.europa.eu/.
Categories, topics:
Energy & Mining, Environment
Last updated:
apr 23, 2017
Indicators value changes by year
At the date of observation
Value
Absolute change
Change from previous value
jan 1, 1971
3.745
+3.745
0.0%
jan 1, 1972
3.75
+0.005
0.13%
jan 1, 1973
3.95
+0.199
5.32%
jan 1, 1974
4.704
+0.755
19.1%
jan 1, 1975
5.505
+0.801
17.02%
jan 1, 1976
5.378
-0.128
-2.32%
jan 1, 1977
5.14
-0.237
-4.42%
jan 1, 1978
4.794
-0.346
-6.74%
jan 1, 1979
4.195
-0.599
-12.49%
jan 1, 1980
4.238
+0.043
1.03%
jan 1, 1981
8.048
+3.81
89.89%
jan 1, 1982
7.724
-0.324
-4.03%
jan 1, 1983
6.134
-1.59
-20.58%
jan 1, 1984
4.758
-1.377
-22.44%
jan 1, 1985
4.337
-0.42
-8.84%
jan 1, 1986
3.93
-0.407
-9.39%
jan 1, 1987
4.513
+0.583
14.82%
jan 1, 1988
4.151
-0.362
-8.02%
jan 1, 1989
4.356
+0.205
4.94%
jan 1, 1990
5.127
+0.771
17.7%
jan 1, 1991
5.359
+0.233
4.54%
jan 1, 1992
5.738
+0.379
7.07%
jan 1, 1993
6.166
+0.428
7.45%
jan 1, 1994
6.063
-0.103
-1.67%
jan 1, 1995
6.074
+0.011
0.18%
jan 1, 1996
6.364
+0.291
4.78%
jan 1, 1997
6.861
+0.497
7.81%
jan 1, 1998
7.992
+1.131
16.48%
jan 1, 1999
8.223
+0.231
2.89%
jan 1, 2000
8.304
+0.081
0.99%
jan 1, 2001
6.995
-1.309
-15.76%
jan 1, 2002
6.898
-0.097
-1.39%
jan 1, 2003
6.954
+0.056
0.81%
jan 1, 2004
7.082
+0.128
1.84%
jan 1, 2005
6.711
-0.371
-5.23%
jan 1, 2006
6.443
-0.268
-4.0%
jan 1, 2007
6.14
-0.303
-4.71%
jan 1, 2008
5.944
-0.195
-3.18%
jan 1, 2009
5.672
-0.272
-4.58%
Ranking of countries by current statistics by years


Comments: