29
/
en
AIzaSyAYiBZKx7MnpbEhh9jyipgxe19OcubqV5w
April 1, 2024
35248
Heavily indebted poor countries (HIPC)
HPC
false
2
1
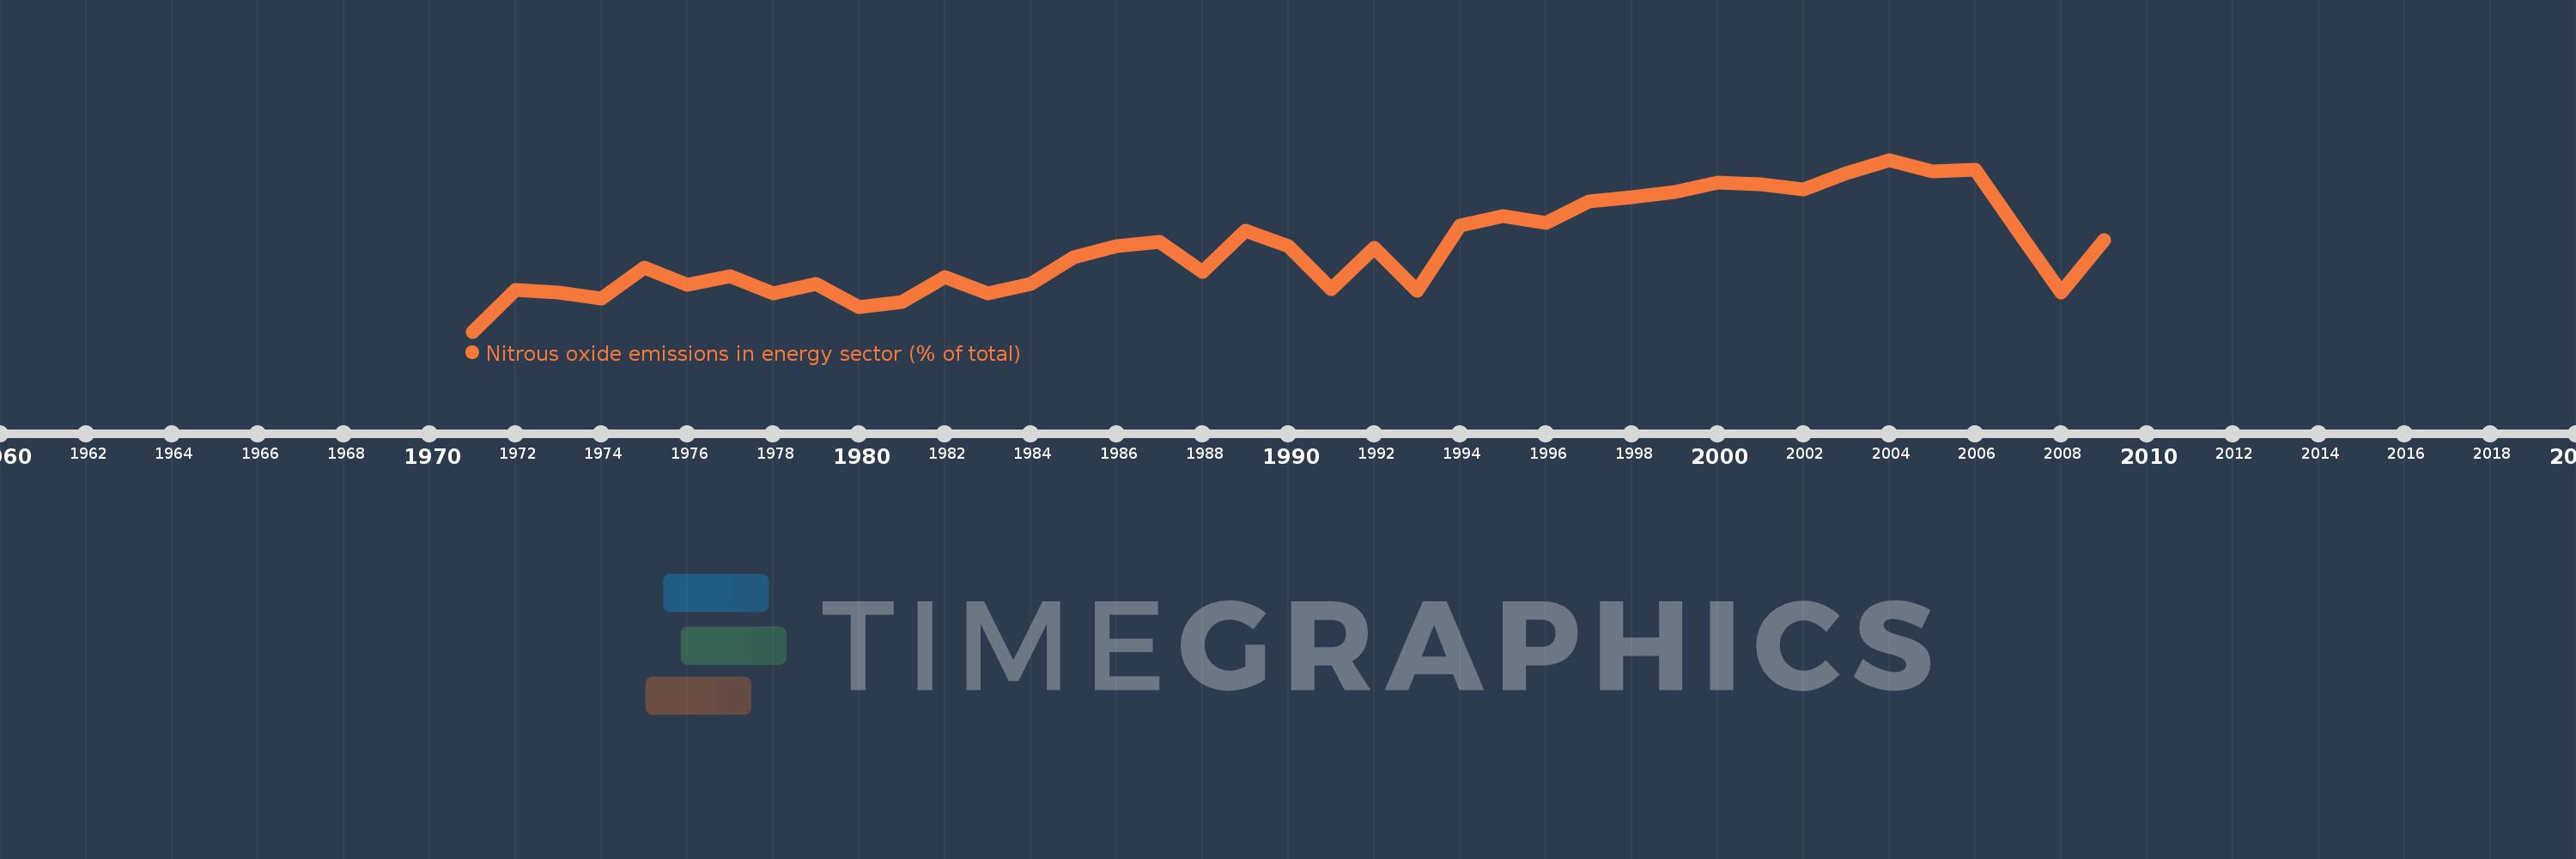
Nitrous oxide emissions in energy sector (% of total)
2009,2008,2007,2006,2005,2004,2003,2002,2001,2000,1999,1998,1997,1996,1995,1994,1993,1992,1991,1990,1989,1988,1987,1986,1985,1984,1983,1982,1981,1980,1979,1978,1977,1976,1975,1974,1973,1972,1971
This statistics in other country:
AfghanistanAlbaniaAlgeriaAmerican SamoaAndorraAngolaAntigua and BarbudaArab WorldArgentinaArmeniaArubaAustraliaAustriaAzerbaijanBahamas, TheBahrainBangladeshBarbadosBelarusBelgiumBelizeBeninBermudaBhutanBoliviaBosnia and HerzegovinaBotswanaBrazilBritish Virgin IslandsBrunei DarussalamBulgariaBurkina FasoBurundiCabo VerdeCambodiaCameroonCanadaCaribbean small statesCayman IslandsCentral African RepublicCentral Europe and the BalticsChadChileChinaColombiaComorosCongo, Dem. Rep.Congo, Rep.Costa RicaCote d'IvoireCroatiaCubaCyprusCzech RepublicDenmarkDjiboutiDominicaDominican RepublicEarly-demographic dividendEast Asia & PacificEast Asia & Pacific (excluding high income)East Asia & Pacific (IDA & IBRD countries)EcuadorEgypt, Arab Rep.El SalvadorEquatorial GuineaEritreaEstoniaEthiopiaEuro areaEurope & Central AsiaEurope & Central Asia (excluding high income)Europe & Central Asia (IDA & IBRD countries)European UnionFaroe IslandsFijiFinlandFragile and conflict affected situationsFranceFrench PolynesiaGabonGambia, TheGeorgiaGermanyGhanaGibraltarGreeceGreenlandGrenadaGuamGuatemalaGuineaGuinea-BissauGuyanaHaitiHeavily indebted poor countries (HIPC)High incomeHondurasHong Kong SAR, ChinaHungaryIBRD onlyIcelandIDA & IBRD totalIDA blendIDA onlyIDA totalIndiaIndonesiaIran, Islamic Rep.IraqIrelandIsraelItalyJamaicaJapanJordanKazakhstanKenyaKiribatiKorea, Dem. People’s Rep.Korea, Rep.KuwaitKyrgyz RepublicLao PDRLate-demographic dividendLatin America & Caribbean Latin America & Caribbean (excluding high income)Latin America & the Caribbean (IDA & IBRD countries)LatviaLeast developed countries: UN classificationLebanonLesothoLiberiaLibyaLithuaniaLow & middle incomeLow incomeLower middle incomeLuxembourgMacao SAR, ChinaMacedonia, FYRMadagascarMalawiMalaysiaMaldivesMaliMaltaMarshall IslandsMauritaniaMauritiusMexicoMicronesia, Fed. Sts.Middle East & North AfricaMiddle East & North Africa (excluding high income)Middle East & North Africa (IDA & IBRD countries)Middle incomeMoldovaMongoliaMoroccoMozambiqueMyanmarNamibiaNauruNepalNetherlandsNew CaledoniaNew ZealandNicaraguaNigerNigeriaNorth AmericaNorthern Mariana IslandsNorwayOECD membersOmanOther small statesPacific island small statesPakistanPalauPanamaPapua New GuineaParaguayPeruPhilippinesPolandPortugalPost-demographic dividendPre-demographic dividendPuerto RicoQatarRomaniaRussian FederationRwandaSamoaSao Tome and PrincipeSaudi ArabiaSenegalSerbiaSeychellesSierra LeoneSingaporeSlovak RepublicSloveniaSmall statesSolomon IslandsSomaliaSouth AfricaSouth AsiaSouth Asia (IDA & IBRD)SpainSri LankaSt. Kitts and NevisSt. LuciaSt. Vincent and the GrenadinesSub-Saharan Africa Sub-Saharan Africa (excluding high income)Sub-Saharan Africa (IDA & IBRD countries)SudanSurinameSwazilandSwedenSwitzerlandSyrian Arab RepublicTajikistanTanzaniaThailandTimor-LesteTogoTongaTrinidad and TobagoTunisiaTurkeyTurkmenistanTurks and Caicos IslandsTuvaluUgandaUkraineUnited Arab EmiratesUnited KingdomUnited StatesUpper middle incomeUruguayUzbekistanVanuatuVenezuela, RBVietnamVirgin Islands (U.S.)WorldYemen, Rep.ZambiaZimbabwe Timeline:
This timeline shows a graph from 1971 to 2009 of Heavily indebted poor countries (HIPC). No data until 1970. Number of actual observations by date: 39.
Source name:
World Development Indicators
Source organization:
World Bank staff estimates from original source: European Commission, Joint Research Centre (JRC)/Netherlands Environmental Assessment Agency (PBL). Emission Database for Global Atmospheric Research (EDGAR): http://edgar.jrc.ec.europa.eu/.
Categories, topics:
Energy & Mining, Environment
Last updated:
apr 23, 2017
Indicators value changes by year
At the date of observation
Value
Absolute change
Change from previous value
jan 1, 1971
1.031
+1.031
0.0%
jan 1, 1972
1.47
+0.439
42.55%
jan 1, 1973
1.448
-0.022
-1.5%
jan 1, 1974
1.385
-0.063
-4.34%
jan 1, 1975
1.707
+0.322
23.23%
jan 1, 1976
1.523
-0.184
-10.78%
jan 1, 1977
1.616
+0.093
6.13%
jan 1, 1978
1.438
-0.178
-11.01%
jan 1, 1979
1.533
+0.095
6.6%
jan 1, 1980
1.287
-0.246
-16.03%
jan 1, 1981
1.341
+0.054
4.2%
jan 1, 1982
1.606
+0.265
19.72%
jan 1, 1983
1.433
-0.173
-10.76%
jan 1, 1984
1.536
+0.103
7.15%
jan 1, 1985
1.819
+0.283
18.41%
jan 1, 1986
1.931
+0.112
6.16%
jan 1, 1987
1.983
+0.052
2.69%
jan 1, 1988
1.658
-0.324
-16.36%
jan 1, 1989
2.101
+0.443
26.7%
jan 1, 1990
1.933
-0.168
-7.98%
jan 1, 1991
1.48
-0.453
-23.45%
jan 1, 1992
1.916
+0.436
29.47%
jan 1, 1993
1.461
-0.455
-23.77%
jan 1, 1994
2.157
+0.697
47.7%
jan 1, 1995
2.254
+0.096
4.46%
jan 1, 1996
2.179
-0.074
-3.3%
jan 1, 1997
2.403
+0.223
10.25%
jan 1, 1998
2.45
+0.048
1.98%
jan 1, 1999
2.51
+0.06
2.43%
jan 1, 2000
2.608
+0.098
3.91%
jan 1, 2001
2.585
-0.023
-0.87%
jan 1, 2002
2.534
-0.051
-1.99%
jan 1, 2003
2.711
+0.177
7.0%
jan 1, 2004
2.848
+0.137
5.06%
jan 1, 2005
2.728
-0.12
-4.22%
jan 1, 2006
2.742
+0.014
0.5%
jan 1, 2007
2.087
-0.655
-23.9%
jan 1, 2008
1.443
-0.644
-30.87%
jan 1, 2009
2.0
+0.558
38.66%
Ranking of countries by current statistics by years


Comments: