29
/
en
AIzaSyAYiBZKx7MnpbEhh9jyipgxe19OcubqV5w
April 1, 2024
90203
Botswana
BWA
true
2
1
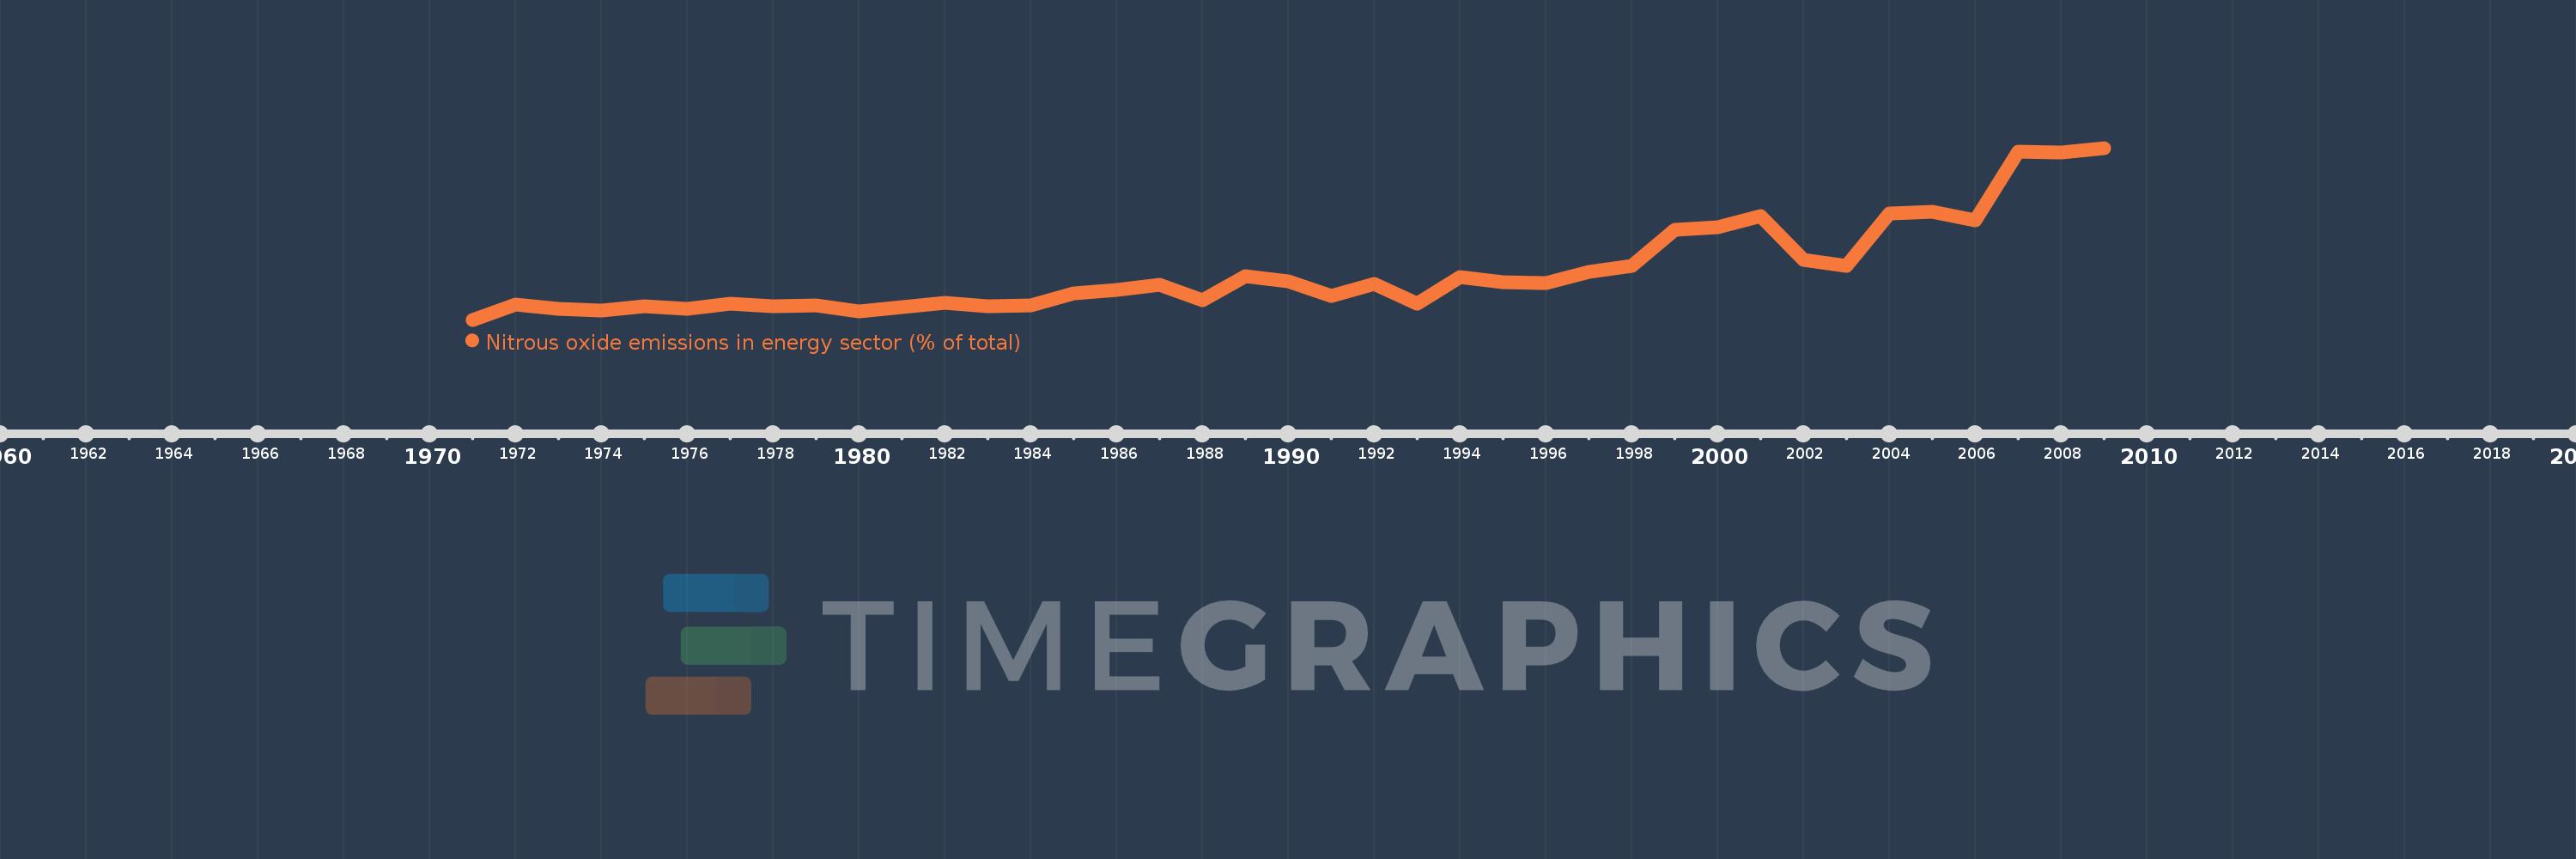
Nitrous oxide emissions in energy sector (% of total)
2009,2008,2007,2006,2005,2004,2003,2002,2001,2000,1999,1998,1997,1996,1995,1994,1993,1992,1991,1990,1989,1988,1987,1986,1985,1984,1983,1982,1981,1980,1979,1978,1977,1976,1975,1974,1973,1972,1971
This statistics in other country:
AfghanistanAlbaniaAlgeriaAmerican SamoaAndorraAngolaAntigua and BarbudaArab WorldArgentinaArmeniaArubaAustraliaAustriaAzerbaijanBahamas, TheBahrainBangladeshBarbadosBelarusBelgiumBelizeBeninBermudaBhutanBoliviaBosnia and HerzegovinaBotswanaBrazilBritish Virgin IslandsBrunei DarussalamBulgariaBurkina FasoBurundiCabo VerdeCambodiaCameroonCanadaCaribbean small statesCayman IslandsCentral African RepublicCentral Europe and the BalticsChadChileChinaColombiaComorosCongo, Dem. Rep.Congo, Rep.Costa RicaCote d'IvoireCroatiaCubaCyprusCzech RepublicDenmarkDjiboutiDominicaDominican RepublicEarly-demographic dividendEast Asia & PacificEast Asia & Pacific (excluding high income)East Asia & Pacific (IDA & IBRD countries)EcuadorEgypt, Arab Rep.El SalvadorEquatorial GuineaEritreaEstoniaEthiopiaEuro areaEurope & Central AsiaEurope & Central Asia (excluding high income)Europe & Central Asia (IDA & IBRD countries)European UnionFaroe IslandsFijiFinlandFragile and conflict affected situationsFranceFrench PolynesiaGabonGambia, TheGeorgiaGermanyGhanaGibraltarGreeceGreenlandGrenadaGuamGuatemalaGuineaGuinea-BissauGuyanaHaitiHeavily indebted poor countries (HIPC)High incomeHondurasHong Kong SAR, ChinaHungaryIBRD onlyIcelandIDA & IBRD totalIDA blendIDA onlyIDA totalIndiaIndonesiaIran, Islamic Rep.IraqIrelandIsraelItalyJamaicaJapanJordanKazakhstanKenyaKiribatiKorea, Dem. People’s Rep.Korea, Rep.KuwaitKyrgyz RepublicLao PDRLate-demographic dividendLatin America & Caribbean Latin America & Caribbean (excluding high income)Latin America & the Caribbean (IDA & IBRD countries)LatviaLeast developed countries: UN classificationLebanonLesothoLiberiaLibyaLithuaniaLow & middle incomeLow incomeLower middle incomeLuxembourgMacao SAR, ChinaMacedonia, FYRMadagascarMalawiMalaysiaMaldivesMaliMaltaMarshall IslandsMauritaniaMauritiusMexicoMicronesia, Fed. Sts.Middle East & North AfricaMiddle East & North Africa (excluding high income)Middle East & North Africa (IDA & IBRD countries)Middle incomeMoldovaMongoliaMoroccoMozambiqueMyanmarNamibiaNauruNepalNetherlandsNew CaledoniaNew ZealandNicaraguaNigerNigeriaNorth AmericaNorthern Mariana IslandsNorwayOECD membersOmanOther small statesPacific island small statesPakistanPalauPanamaPapua New GuineaParaguayPeruPhilippinesPolandPortugalPost-demographic dividendPre-demographic dividendPuerto RicoQatarRomaniaRussian FederationRwandaSamoaSao Tome and PrincipeSaudi ArabiaSenegalSerbiaSeychellesSierra LeoneSingaporeSlovak RepublicSloveniaSmall statesSolomon IslandsSomaliaSouth AfricaSouth AsiaSouth Asia (IDA & IBRD)SpainSri LankaSt. Kitts and NevisSt. LuciaSt. Vincent and the GrenadinesSub-Saharan Africa Sub-Saharan Africa (excluding high income)Sub-Saharan Africa (IDA & IBRD countries)SudanSurinameSwazilandSwedenSwitzerlandSyrian Arab RepublicTajikistanTanzaniaThailandTimor-LesteTogoTongaTrinidad and TobagoTunisiaTurkeyTurkmenistanTurks and Caicos IslandsTuvaluUgandaUkraineUnited Arab EmiratesUnited KingdomUnited StatesUpper middle incomeUruguayUzbekistanVanuatuVenezuela, RBVietnamVirgin Islands (U.S.)WorldYemen, Rep.ZambiaZimbabwe Timeline:
This timeline shows a graph from 1971 to 2009 of Botswana. No data until 1970. Number of actual observations by date: 39.
Source name:
World Development Indicators
Source organization:
World Bank staff estimates from original source: European Commission, Joint Research Centre (JRC)/Netherlands Environmental Assessment Agency (PBL). Emission Database for Global Atmospheric Research (EDGAR): http://edgar.jrc.ec.europa.eu/.
Categories, topics:
Energy & Mining, Environment
Last updated:
apr 23, 2017
Indicators value changes by year
At the date of observation
Value
Absolute change
Change from previous value
jan 1, 1971
0.224
+0.224
0.0%
jan 1, 1972
0.457
+0.233
104.27%
jan 1, 1973
0.399
-0.058
-12.6%
jan 1, 1974
0.374
-0.025
-6.22%
jan 1, 1975
0.439
+0.064
17.12%
jan 1, 1976
0.39
-0.049
-11.15%
jan 1, 1977
0.471
+0.081
20.76%
jan 1, 1978
0.434
-0.037
-7.85%
jan 1, 1979
0.445
+0.011
2.57%
jan 1, 1980
0.354
-0.091
-20.51%
jan 1, 1981
0.425
+0.072
20.23%
jan 1, 1982
0.485
+0.06
14.21%
jan 1, 1983
0.435
-0.05
-10.31%
jan 1, 1984
0.455
+0.02
4.54%
jan 1, 1985
0.631
+0.176
38.6%
jan 1, 1986
0.698
+0.067
10.6%
jan 1, 1987
0.768
+0.071
10.13%
jan 1, 1988
0.533
-0.235
-30.63%
jan 1, 1989
0.912
+0.379
71.09%
jan 1, 1990
0.824
-0.088
-9.63%
jan 1, 1991
0.592
-0.232
-28.17%
jan 1, 1992
0.78
+0.188
31.79%
jan 1, 1993
0.473
-0.307
-39.3%
jan 1, 1994
0.892
+0.419
88.47%
jan 1, 1995
0.814
-0.078
-8.78%
jan 1, 1996
0.797
-0.017
-2.11%
jan 1, 1997
0.981
+0.184
23.08%
jan 1, 1998
1.071
+0.09
9.22%
jan 1, 1999
1.635
+0.564
52.64%
jan 1, 2000
1.67
+0.035
2.14%
jan 1, 2001
1.854
+0.184
11.02%
jan 1, 2002
1.157
-0.697
-37.6%
jan 1, 2003
1.075
-0.082
-7.09%
jan 1, 2004
1.886
+0.811
75.45%
jan 1, 2005
1.92
+0.033
1.77%
jan 1, 2006
1.788
-0.132
-6.86%
jan 1, 2007
2.857
+1.069
59.79%
jan 1, 2008
2.851
-0.006
-0.21%
jan 1, 2009
2.919
+0.068
2.38%
Ranking of countries by current statistics by years


Comments: