29
/
en
AIzaSyAYiBZKx7MnpbEhh9jyipgxe19OcubqV5w
April 1, 2024
238585
Seychelles
SYC
true
2
1
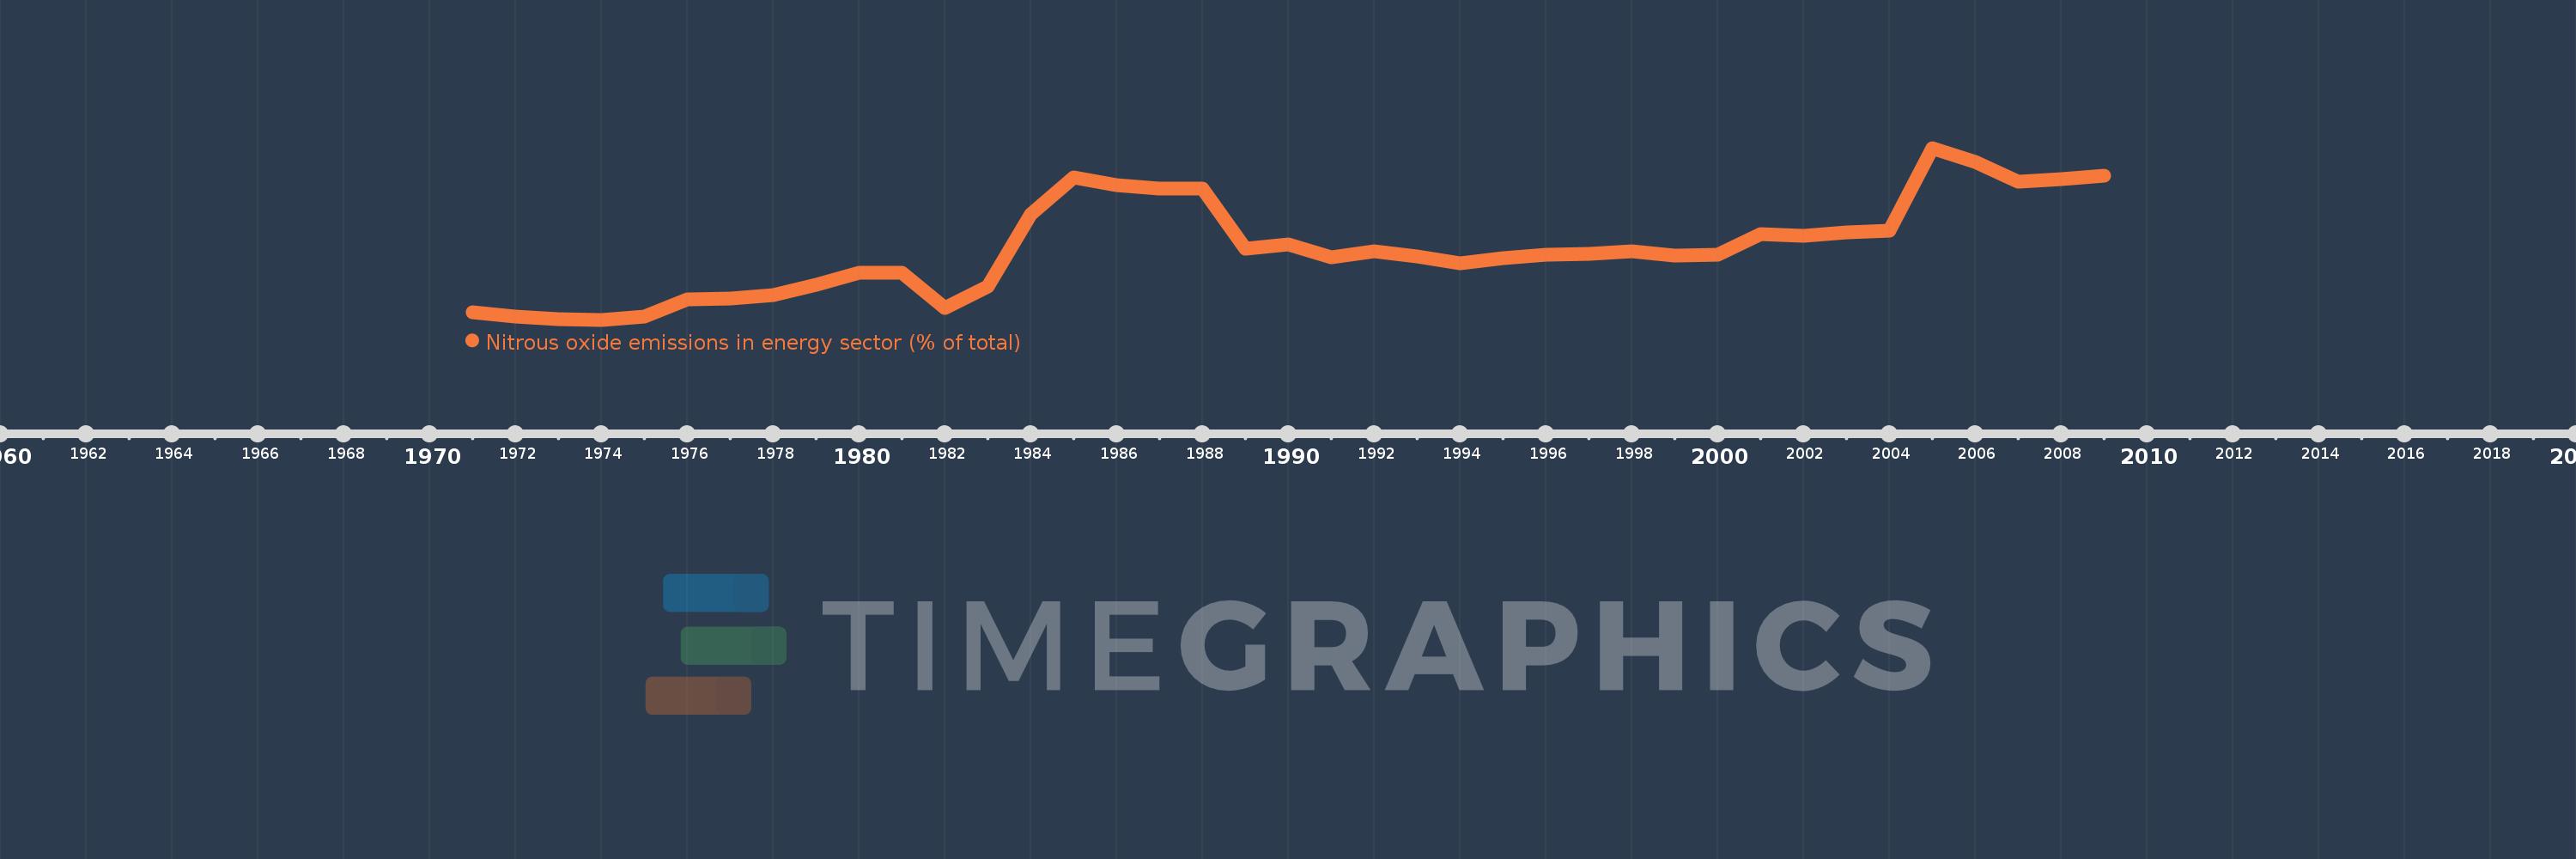
Nitrous oxide emissions in energy sector (% of total)
2009,2008,2007,2006,2005,2004,2003,2002,2001,2000,1999,1998,1997,1996,1995,1994,1993,1992,1991,1990,1989,1988,1987,1986,1985,1984,1983,1982,1981,1980,1979,1978,1977,1976,1975,1974,1973,1972,1971
This statistics in other country:
AfghanistanAlbaniaAlgeriaAmerican SamoaAndorraAngolaAntigua and BarbudaArab WorldArgentinaArmeniaArubaAustraliaAustriaAzerbaijanBahamas, TheBahrainBangladeshBarbadosBelarusBelgiumBelizeBeninBermudaBhutanBoliviaBosnia and HerzegovinaBotswanaBrazilBritish Virgin IslandsBrunei DarussalamBulgariaBurkina FasoBurundiCabo VerdeCambodiaCameroonCanadaCaribbean small statesCayman IslandsCentral African RepublicCentral Europe and the BalticsChadChileChinaColombiaComorosCongo, Dem. Rep.Congo, Rep.Costa RicaCote d'IvoireCroatiaCubaCyprusCzech RepublicDenmarkDjiboutiDominicaDominican RepublicEarly-demographic dividendEast Asia & PacificEast Asia & Pacific (excluding high income)East Asia & Pacific (IDA & IBRD countries)EcuadorEgypt, Arab Rep.El SalvadorEquatorial GuineaEritreaEstoniaEthiopiaEuro areaEurope & Central AsiaEurope & Central Asia (excluding high income)Europe & Central Asia (IDA & IBRD countries)European UnionFaroe IslandsFijiFinlandFragile and conflict affected situationsFranceFrench PolynesiaGabonGambia, TheGeorgiaGermanyGhanaGibraltarGreeceGreenlandGrenadaGuamGuatemalaGuineaGuinea-BissauGuyanaHaitiHeavily indebted poor countries (HIPC)High incomeHondurasHong Kong SAR, ChinaHungaryIBRD onlyIcelandIDA & IBRD totalIDA blendIDA onlyIDA totalIndiaIndonesiaIran, Islamic Rep.IraqIrelandIsraelItalyJamaicaJapanJordanKazakhstanKenyaKiribatiKorea, Dem. People’s Rep.Korea, Rep.KuwaitKyrgyz RepublicLao PDRLate-demographic dividendLatin America & Caribbean Latin America & Caribbean (excluding high income)Latin America & the Caribbean (IDA & IBRD countries)LatviaLeast developed countries: UN classificationLebanonLesothoLiberiaLibyaLithuaniaLow & middle incomeLow incomeLower middle incomeLuxembourgMacao SAR, ChinaMacedonia, FYRMadagascarMalawiMalaysiaMaldivesMaliMaltaMarshall IslandsMauritaniaMauritiusMexicoMicronesia, Fed. Sts.Middle East & North AfricaMiddle East & North Africa (excluding high income)Middle East & North Africa (IDA & IBRD countries)Middle incomeMoldovaMongoliaMoroccoMozambiqueMyanmarNamibiaNauruNepalNetherlandsNew CaledoniaNew ZealandNicaraguaNigerNigeriaNorth AmericaNorthern Mariana IslandsNorwayOECD membersOmanOther small statesPacific island small statesPakistanPalauPanamaPapua New GuineaParaguayPeruPhilippinesPolandPortugalPost-demographic dividendPre-demographic dividendPuerto RicoQatarRomaniaRussian FederationRwandaSamoaSao Tome and PrincipeSaudi ArabiaSenegalSerbiaSeychellesSierra LeoneSingaporeSlovak RepublicSloveniaSmall statesSolomon IslandsSomaliaSouth AfricaSouth AsiaSouth Asia (IDA & IBRD)SpainSri LankaSt. Kitts and NevisSt. LuciaSt. Vincent and the GrenadinesSub-Saharan Africa Sub-Saharan Africa (excluding high income)Sub-Saharan Africa (IDA & IBRD countries)SudanSurinameSwazilandSwedenSwitzerlandSyrian Arab RepublicTajikistanTanzaniaThailandTimor-LesteTogoTongaTrinidad and TobagoTunisiaTurkeyTurkmenistanTurks and Caicos IslandsTuvaluUgandaUkraineUnited Arab EmiratesUnited KingdomUnited StatesUpper middle incomeUruguayUzbekistanVanuatuVenezuela, RBVietnamVirgin Islands (U.S.)WorldYemen, Rep.ZambiaZimbabwe Timeline:
This timeline shows a graph from 1971 to 2009 of Seychelles. No data until 1970. Number of actual observations by date: 39.
Source name:
World Development Indicators
Source organization:
World Bank staff estimates from original source: European Commission, Joint Research Centre (JRC)/Netherlands Environmental Assessment Agency (PBL). Emission Database for Global Atmospheric Research (EDGAR): http://edgar.jrc.ec.europa.eu/.
Categories, topics:
Energy & Mining, Environment
Last updated:
apr 23, 2017
Indicators value changes by year
Maximum:
24.832
jan 1, 2005
At the date of observation
Value
Absolute change
Change from previous value
jan 1, 1971
5.716
+5.716
0.0%
jan 1, 1972
5.265
-0.451
-7.9%
jan 1, 1973
4.968
-0.297
-5.64%
jan 1, 1974
4.867
-0.102
-2.05%
jan 1, 1975
5.273
+0.407
8.35%
jan 1, 1976
7.183
+1.909
36.21%
jan 1, 1977
7.36
+0.178
2.48%
jan 1, 1978
7.712
+0.351
4.78%
jan 1, 1979
8.954
+1.242
16.1%
jan 1, 1980
10.29
+1.336
14.93%
jan 1, 1981
10.323
+0.033
0.32%
jan 1, 1982
6.233
-4.09
-39.62%
jan 1, 1983
8.686
+2.453
39.36%
jan 1, 1984
17.116
+8.43
97.06%
jan 1, 1985
21.382
+4.266
24.92%
jan 1, 1986
20.514
-0.868
-4.06%
jan 1, 1987
20.099
-0.415
-2.02%
jan 1, 1988
20.094
-0.005
-0.03%
jan 1, 1989
13.135
-6.958
-34.63%
jan 1, 1990
13.669
+0.534
4.06%
jan 1, 1991
12.078
-1.59
-11.63%
jan 1, 1992
12.852
+0.774
6.4%
jan 1, 1993
12.229
-0.623
-4.84%
jan 1, 1994
11.416
-0.814
-6.65%
jan 1, 1995
11.996
+0.58
5.08%
jan 1, 1996
12.471
+0.476
3.97%
jan 1, 1997
12.573
+0.102
0.82%
jan 1, 1998
12.82
+0.247
1.97%
jan 1, 1999
12.318
-0.502
-3.92%
jan 1, 2000
12.453
+0.135
1.1%
jan 1, 2001
14.797
+2.343
18.82%
jan 1, 2002
14.594
-0.202
-1.37%
jan 1, 2003
15.053
+0.459
3.14%
jan 1, 2004
15.244
+0.191
1.27%
jan 1, 2005
24.832
+9.588
62.89%
jan 1, 2006
23.156
-1.676
-6.75%
jan 1, 2007
20.908
-2.248
-9.71%
jan 1, 2008
21.225
+0.317
1.52%
jan 1, 2009
21.596
+0.371
1.75%
Ranking of countries by current statistics by years


Comments: