29
/
en
AIzaSyAYiBZKx7MnpbEhh9jyipgxe19OcubqV5w
April 1, 2024
224009
Philippines
PHL
true
2
1
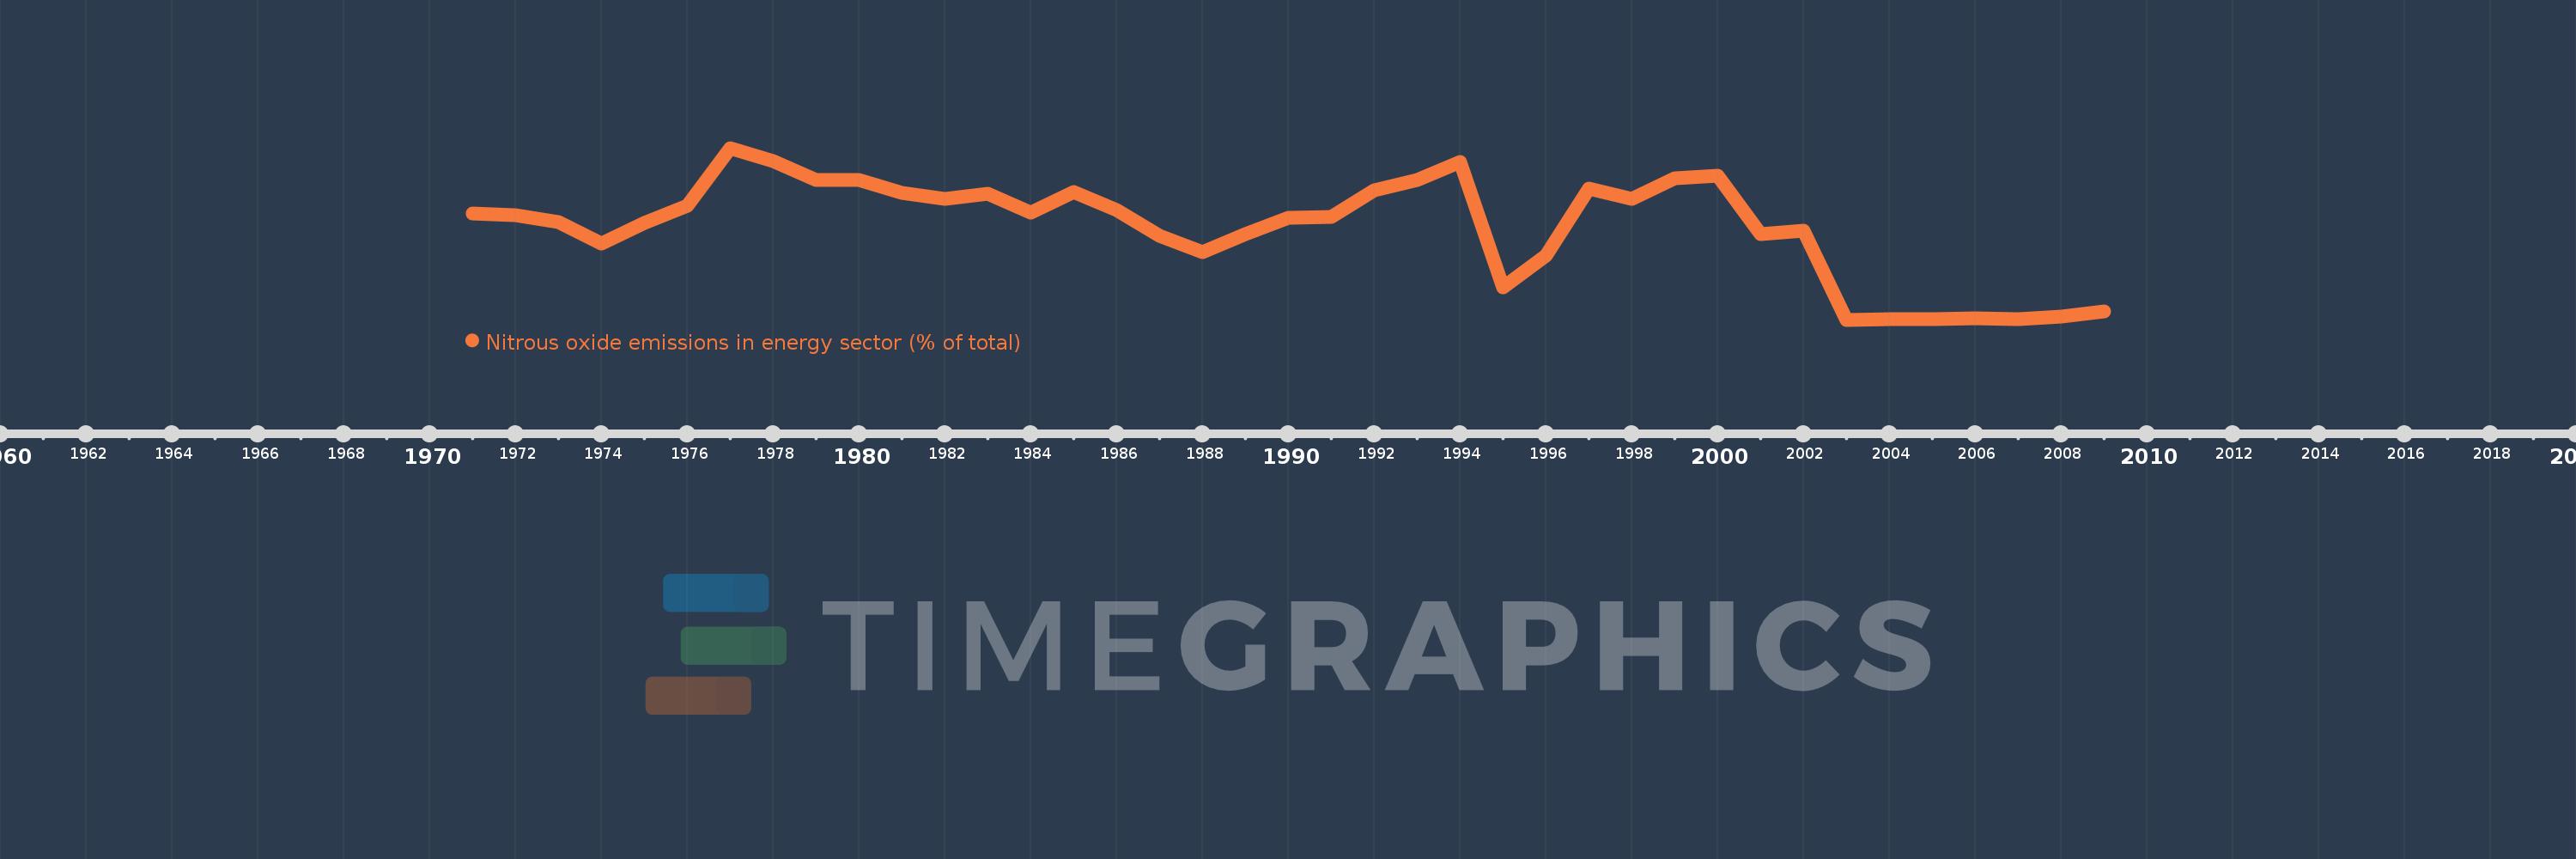
Nitrous oxide emissions in energy sector (% of total)
2009,2008,2007,2006,2005,2004,2003,2002,2001,2000,1999,1998,1997,1996,1995,1994,1993,1992,1991,1990,1989,1988,1987,1986,1985,1984,1983,1982,1981,1980,1979,1978,1977,1976,1975,1974,1973,1972,1971
This statistics in other country:
AfghanistanAlbaniaAlgeriaAmerican SamoaAndorraAngolaAntigua and BarbudaArab WorldArgentinaArmeniaArubaAustraliaAustriaAzerbaijanBahamas, TheBahrainBangladeshBarbadosBelarusBelgiumBelizeBeninBermudaBhutanBoliviaBosnia and HerzegovinaBotswanaBrazilBritish Virgin IslandsBrunei DarussalamBulgariaBurkina FasoBurundiCabo VerdeCambodiaCameroonCanadaCaribbean small statesCayman IslandsCentral African RepublicCentral Europe and the BalticsChadChileChinaColombiaComorosCongo, Dem. Rep.Congo, Rep.Costa RicaCote d'IvoireCroatiaCubaCyprusCzech RepublicDenmarkDjiboutiDominicaDominican RepublicEarly-demographic dividendEast Asia & PacificEast Asia & Pacific (excluding high income)East Asia & Pacific (IDA & IBRD countries)EcuadorEgypt, Arab Rep.El SalvadorEquatorial GuineaEritreaEstoniaEthiopiaEuro areaEurope & Central AsiaEurope & Central Asia (excluding high income)Europe & Central Asia (IDA & IBRD countries)European UnionFaroe IslandsFijiFinlandFragile and conflict affected situationsFranceFrench PolynesiaGabonGambia, TheGeorgiaGermanyGhanaGibraltarGreeceGreenlandGrenadaGuamGuatemalaGuineaGuinea-BissauGuyanaHaitiHeavily indebted poor countries (HIPC)High incomeHondurasHong Kong SAR, ChinaHungaryIBRD onlyIcelandIDA & IBRD totalIDA blendIDA onlyIDA totalIndiaIndonesiaIran, Islamic Rep.IraqIrelandIsraelItalyJamaicaJapanJordanKazakhstanKenyaKiribatiKorea, Dem. People’s Rep.Korea, Rep.KuwaitKyrgyz RepublicLao PDRLate-demographic dividendLatin America & Caribbean Latin America & Caribbean (excluding high income)Latin America & the Caribbean (IDA & IBRD countries)LatviaLeast developed countries: UN classificationLebanonLesothoLiberiaLibyaLithuaniaLow & middle incomeLow incomeLower middle incomeLuxembourgMacao SAR, ChinaMacedonia, FYRMadagascarMalawiMalaysiaMaldivesMaliMaltaMarshall IslandsMauritaniaMauritiusMexicoMicronesia, Fed. Sts.Middle East & North AfricaMiddle East & North Africa (excluding high income)Middle East & North Africa (IDA & IBRD countries)Middle incomeMoldovaMongoliaMoroccoMozambiqueMyanmarNamibiaNauruNepalNetherlandsNew CaledoniaNew ZealandNicaraguaNigerNigeriaNorth AmericaNorthern Mariana IslandsNorwayOECD membersOmanOther small statesPacific island small statesPakistanPalauPanamaPapua New GuineaParaguayPeruPhilippinesPolandPortugalPost-demographic dividendPre-demographic dividendPuerto RicoQatarRomaniaRussian FederationRwandaSamoaSao Tome and PrincipeSaudi ArabiaSenegalSerbiaSeychellesSierra LeoneSingaporeSlovak RepublicSloveniaSmall statesSolomon IslandsSomaliaSouth AfricaSouth AsiaSouth Asia (IDA & IBRD)SpainSri LankaSt. Kitts and NevisSt. LuciaSt. Vincent and the GrenadinesSub-Saharan Africa Sub-Saharan Africa (excluding high income)Sub-Saharan Africa (IDA & IBRD countries)SudanSurinameSwazilandSwedenSwitzerlandSyrian Arab RepublicTajikistanTanzaniaThailandTimor-LesteTogoTongaTrinidad and TobagoTunisiaTurkeyTurkmenistanTurks and Caicos IslandsTuvaluUgandaUkraineUnited Arab EmiratesUnited KingdomUnited StatesUpper middle incomeUruguayUzbekistanVanuatuVenezuela, RBVietnamVirgin Islands (U.S.)WorldYemen, Rep.ZambiaZimbabwe Timeline:
This timeline shows a graph from 1971 to 2009 of Philippines. No data until 1970. Number of actual observations by date: 39.
Source name:
World Development Indicators
Source organization:
World Bank staff estimates from original source: European Commission, Joint Research Centre (JRC)/Netherlands Environmental Assessment Agency (PBL). Emission Database for Global Atmospheric Research (EDGAR): http://edgar.jrc.ec.europa.eu/.
Categories, topics:
Energy & Mining, Environment
Last updated:
apr 23, 2017
Indicators value changes by year
Maximum:
11.954
jan 1, 1977
At the date of observation
Value
Absolute change
Change from previous value
jan 1, 1971
9.613
+9.613
0.0%
jan 1, 1972
9.536
-0.077
-0.81%
jan 1, 1973
9.307
-0.229
-2.4%
jan 1, 1974
8.531
-0.776
-8.34%
jan 1, 1975
9.265
+0.734
8.6%
jan 1, 1976
9.892
+0.628
6.77%
jan 1, 1977
11.954
+2.062
20.84%
jan 1, 1978
11.47
-0.484
-4.05%
jan 1, 1979
10.789
-0.681
-5.94%
jan 1, 1980
10.804
+0.015
0.14%
jan 1, 1981
10.35
-0.454
-4.2%
jan 1, 1982
10.14
-0.211
-2.03%
jan 1, 1983
10.317
+0.177
1.74%
jan 1, 1984
9.636
-0.68
-6.59%
jan 1, 1985
10.378
+0.742
7.7%
jan 1, 1986
9.714
-0.665
-6.4%
jan 1, 1987
8.795
-0.919
-9.46%
jan 1, 1988
8.201
-0.593
-6.75%
jan 1, 1989
8.858
+0.657
8.01%
jan 1, 1990
9.448
+0.589
6.65%
jan 1, 1991
9.469
+0.021
0.22%
jan 1, 1992
10.423
+0.954
10.08%
jan 1, 1993
10.789
+0.366
3.51%
jan 1, 1994
11.436
+0.647
6.0%
jan 1, 1995
6.944
-4.493
-39.28%
jan 1, 1996
8.096
+1.152
16.59%
jan 1, 1997
10.485
+2.389
29.51%
jan 1, 1998
10.132
-0.353
-3.37%
jan 1, 1999
10.858
+0.726
7.16%
jan 1, 2000
10.964
+0.106
0.98%
jan 1, 2001
8.852
-2.112
-19.26%
jan 1, 2002
8.999
+0.148
1.67%
jan 1, 2003
5.785
-3.215
-35.72%
jan 1, 2004
5.809
+0.024
0.42%
jan 1, 2005
5.814
+0.006
0.1%
jan 1, 2006
5.833
+0.019
0.33%
jan 1, 2007
5.796
-0.037
-0.63%
jan 1, 2008
5.898
+0.102
1.75%
jan 1, 2009
6.072
+0.174
2.95%
Ranking of countries by current statistics by years


Comments: