29
/
en
AIzaSyAYiBZKx7MnpbEhh9jyipgxe19OcubqV5w
April 1, 2024
27575
East Asia & Pacific
EAS
false
2
1
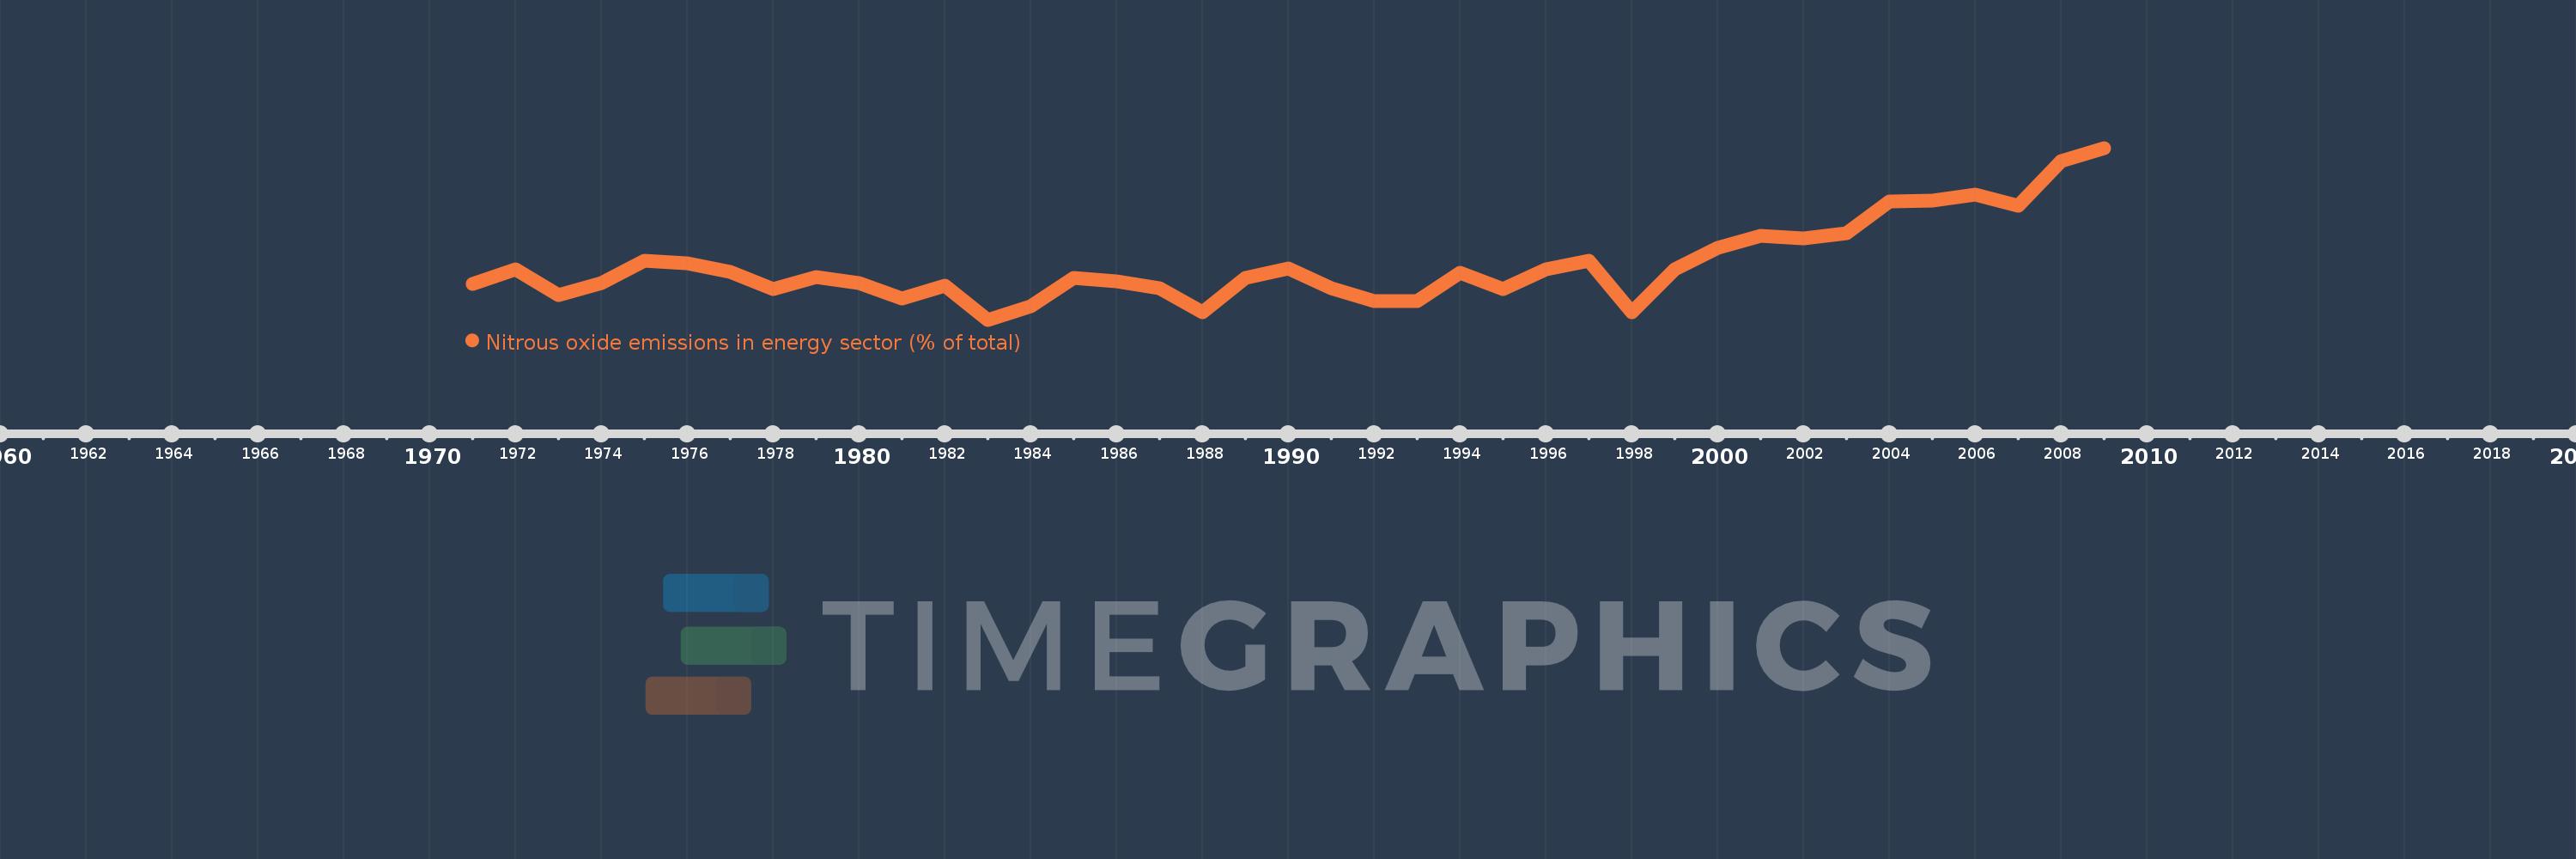
Nitrous oxide emissions in energy sector (% of total)
2009,2008,2007,2006,2005,2004,2003,2002,2001,2000,1999,1998,1997,1996,1995,1994,1993,1992,1991,1990,1989,1988,1987,1986,1985,1984,1983,1982,1981,1980,1979,1978,1977,1976,1975,1974,1973,1972,1971
This statistics in other country:
AfghanistanAlbaniaAlgeriaAmerican SamoaAndorraAngolaAntigua and BarbudaArab WorldArgentinaArmeniaArubaAustraliaAustriaAzerbaijanBahamas, TheBahrainBangladeshBarbadosBelarusBelgiumBelizeBeninBermudaBhutanBoliviaBosnia and HerzegovinaBotswanaBrazilBritish Virgin IslandsBrunei DarussalamBulgariaBurkina FasoBurundiCabo VerdeCambodiaCameroonCanadaCaribbean small statesCayman IslandsCentral African RepublicCentral Europe and the BalticsChadChileChinaColombiaComorosCongo, Dem. Rep.Congo, Rep.Costa RicaCote d'IvoireCroatiaCubaCyprusCzech RepublicDenmarkDjiboutiDominicaDominican RepublicEarly-demographic dividendEast Asia & PacificEast Asia & Pacific (excluding high income)East Asia & Pacific (IDA & IBRD countries)EcuadorEgypt, Arab Rep.El SalvadorEquatorial GuineaEritreaEstoniaEthiopiaEuro areaEurope & Central AsiaEurope & Central Asia (excluding high income)Europe & Central Asia (IDA & IBRD countries)European UnionFaroe IslandsFijiFinlandFragile and conflict affected situationsFranceFrench PolynesiaGabonGambia, TheGeorgiaGermanyGhanaGibraltarGreeceGreenlandGrenadaGuamGuatemalaGuineaGuinea-BissauGuyanaHaitiHeavily indebted poor countries (HIPC)High incomeHondurasHong Kong SAR, ChinaHungaryIBRD onlyIcelandIDA & IBRD totalIDA blendIDA onlyIDA totalIndiaIndonesiaIran, Islamic Rep.IraqIrelandIsraelItalyJamaicaJapanJordanKazakhstanKenyaKiribatiKorea, Dem. People’s Rep.Korea, Rep.KuwaitKyrgyz RepublicLao PDRLate-demographic dividendLatin America & Caribbean Latin America & Caribbean (excluding high income)Latin America & the Caribbean (IDA & IBRD countries)LatviaLeast developed countries: UN classificationLebanonLesothoLiberiaLibyaLithuaniaLow & middle incomeLow incomeLower middle incomeLuxembourgMacao SAR, ChinaMacedonia, FYRMadagascarMalawiMalaysiaMaldivesMaliMaltaMarshall IslandsMauritaniaMauritiusMexicoMicronesia, Fed. Sts.Middle East & North AfricaMiddle East & North Africa (excluding high income)Middle East & North Africa (IDA & IBRD countries)Middle incomeMoldovaMongoliaMoroccoMozambiqueMyanmarNamibiaNauruNepalNetherlandsNew CaledoniaNew ZealandNicaraguaNigerNigeriaNorth AmericaNorthern Mariana IslandsNorwayOECD membersOmanOther small statesPacific island small statesPakistanPalauPanamaPapua New GuineaParaguayPeruPhilippinesPolandPortugalPost-demographic dividendPre-demographic dividendPuerto RicoQatarRomaniaRussian FederationRwandaSamoaSao Tome and PrincipeSaudi ArabiaSenegalSerbiaSeychellesSierra LeoneSingaporeSlovak RepublicSloveniaSmall statesSolomon IslandsSomaliaSouth AfricaSouth AsiaSouth Asia (IDA & IBRD)SpainSri LankaSt. Kitts and NevisSt. LuciaSt. Vincent and the GrenadinesSub-Saharan Africa Sub-Saharan Africa (excluding high income)Sub-Saharan Africa (IDA & IBRD countries)SudanSurinameSwazilandSwedenSwitzerlandSyrian Arab RepublicTajikistanTanzaniaThailandTimor-LesteTogoTongaTrinidad and TobagoTunisiaTurkeyTurkmenistanTurks and Caicos IslandsTuvaluUgandaUkraineUnited Arab EmiratesUnited KingdomUnited StatesUpper middle incomeUruguayUzbekistanVanuatuVenezuela, RBVietnamVirgin Islands (U.S.)WorldYemen, Rep.ZambiaZimbabwe Timeline:
This timeline shows a graph from 1971 to 2009 of East Asia & Pacific. No data until 1970. Number of actual observations by date: 39.
Source name:
World Development Indicators
Source organization:
World Bank staff estimates from original source: European Commission, Joint Research Centre (JRC)/Netherlands Environmental Assessment Agency (PBL). Emission Database for Global Atmospheric Research (EDGAR): http://edgar.jrc.ec.europa.eu/.
Categories, topics:
Energy & Mining, Environment
Last updated:
apr 23, 2017
Indicators value changes by year
At the date of observation
Value
Absolute change
Change from previous value
jan 1, 1971
5.691
+5.691
0.0%
jan 1, 1972
6.108
+0.418
7.34%
jan 1, 1973
5.366
-0.743
-12.16%
jan 1, 1974
5.72
+0.354
6.6%
jan 1, 1975
6.358
+0.638
11.15%
jan 1, 1976
6.296
-0.062
-0.97%
jan 1, 1977
6.043
-0.253
-4.02%
jan 1, 1978
5.546
-0.497
-8.23%
jan 1, 1979
5.896
+0.35
6.32%
jan 1, 1980
5.705
-0.191
-3.24%
jan 1, 1981
5.273
-0.432
-7.57%
jan 1, 1982
5.653
+0.38
7.22%
jan 1, 1983
4.66
-0.993
-17.56%
jan 1, 1984
5.057
+0.397
8.52%
jan 1, 1985
5.859
+0.802
15.85%
jan 1, 1986
5.761
-0.097
-1.66%
jan 1, 1987
5.573
-0.189
-3.28%
jan 1, 1988
4.869
-0.703
-12.62%
jan 1, 1989
5.867
+0.998
20.49%
jan 1, 1990
6.142
+0.275
4.68%
jan 1, 1991
5.575
-0.567
-9.24%
jan 1, 1992
5.197
-0.378
-6.78%
jan 1, 1993
5.199
+0.002
0.04%
jan 1, 1994
6.023
+0.824
15.85%
jan 1, 1995
5.55
-0.473
-7.85%
jan 1, 1996
6.11
+0.56
10.08%
jan 1, 1997
6.367
+0.257
4.2%
jan 1, 1998
4.878
-1.488
-23.38%
jan 1, 1999
6.111
+1.233
25.27%
jan 1, 2000
6.726
+0.614
10.05%
jan 1, 2001
7.071
+0.346
5.14%
jan 1, 2002
6.993
-0.078
-1.11%
jan 1, 2003
7.144
+0.151
2.16%
jan 1, 2004
8.053
+0.908
12.71%
jan 1, 2005
8.098
+0.045
0.56%
jan 1, 2006
8.261
+0.163
2.01%
jan 1, 2007
7.948
-0.313
-3.79%
jan 1, 2008
9.236
+1.288
16.21%
jan 1, 2009
9.603
+0.367
3.98%
Ranking of countries by current statistics by years


Comments: