29
/
en
AIzaSyAYiBZKx7MnpbEhh9jyipgxe19OcubqV5w
April 1, 2024
271207
Turks and Caicos Islands
TCA
true
2
1
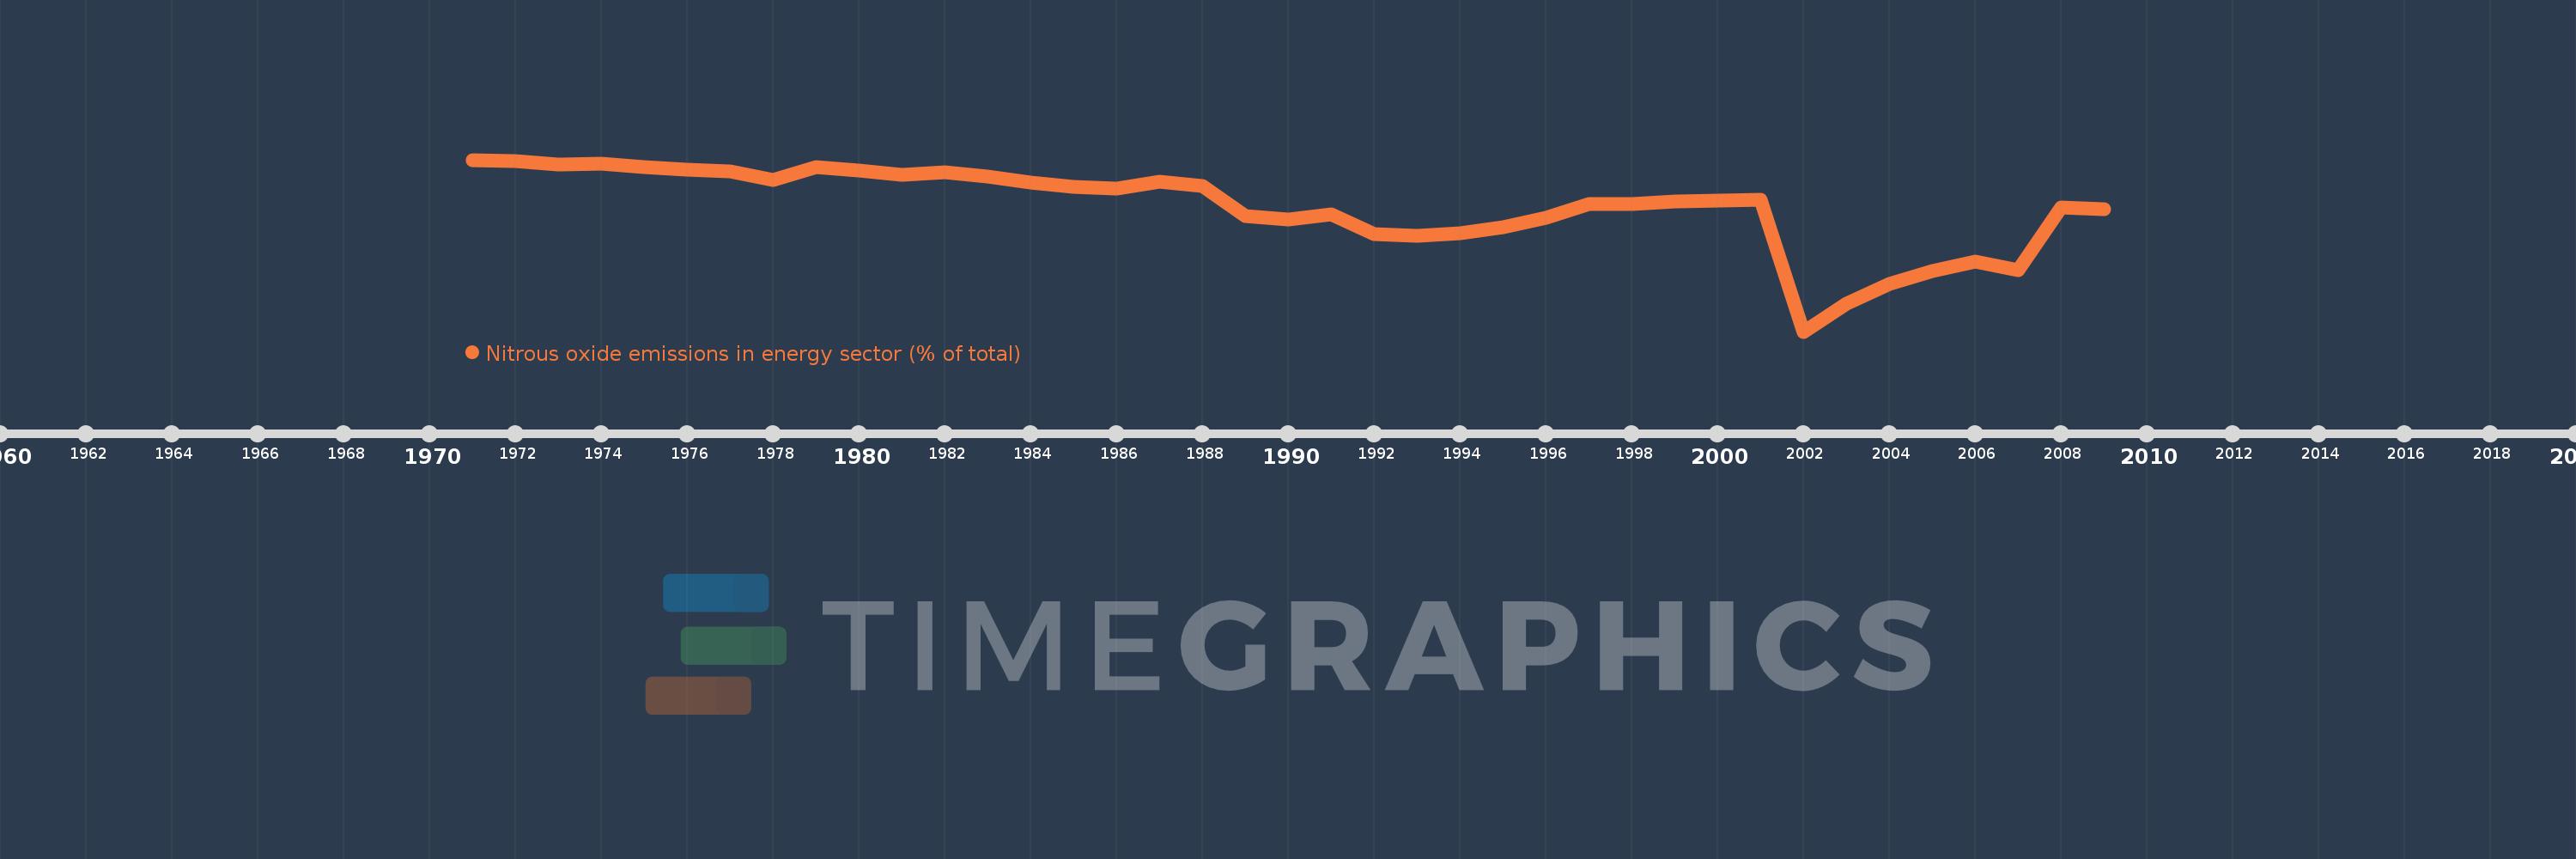
Nitrous oxide emissions in energy sector (% of total)
2009,2008,2007,2006,2005,2004,2003,2002,2001,2000,1999,1998,1997,1996,1995,1994,1993,1992,1991,1990,1989,1988,1987,1986,1985,1984,1983,1982,1981,1980,1979,1978,1977,1976,1975,1974,1973,1972,1971
This statistics in other country:
AfghanistanAlbaniaAlgeriaAmerican SamoaAndorraAngolaAntigua and BarbudaArab WorldArgentinaArmeniaArubaAustraliaAustriaAzerbaijanBahamas, TheBahrainBangladeshBarbadosBelarusBelgiumBelizeBeninBermudaBhutanBoliviaBosnia and HerzegovinaBotswanaBrazilBritish Virgin IslandsBrunei DarussalamBulgariaBurkina FasoBurundiCabo VerdeCambodiaCameroonCanadaCaribbean small statesCayman IslandsCentral African RepublicCentral Europe and the BalticsChadChileChinaColombiaComorosCongo, Dem. Rep.Congo, Rep.Costa RicaCote d'IvoireCroatiaCubaCyprusCzech RepublicDenmarkDjiboutiDominicaDominican RepublicEarly-demographic dividendEast Asia & PacificEast Asia & Pacific (excluding high income)East Asia & Pacific (IDA & IBRD countries)EcuadorEgypt, Arab Rep.El SalvadorEquatorial GuineaEritreaEstoniaEthiopiaEuro areaEurope & Central AsiaEurope & Central Asia (excluding high income)Europe & Central Asia (IDA & IBRD countries)European UnionFaroe IslandsFijiFinlandFragile and conflict affected situationsFranceFrench PolynesiaGabonGambia, TheGeorgiaGermanyGhanaGibraltarGreeceGreenlandGrenadaGuamGuatemalaGuineaGuinea-BissauGuyanaHaitiHeavily indebted poor countries (HIPC)High incomeHondurasHong Kong SAR, ChinaHungaryIBRD onlyIcelandIDA & IBRD totalIDA blendIDA onlyIDA totalIndiaIndonesiaIran, Islamic Rep.IraqIrelandIsraelItalyJamaicaJapanJordanKazakhstanKenyaKiribatiKorea, Dem. People’s Rep.Korea, Rep.KuwaitKyrgyz RepublicLao PDRLate-demographic dividendLatin America & Caribbean Latin America & Caribbean (excluding high income)Latin America & the Caribbean (IDA & IBRD countries)LatviaLeast developed countries: UN classificationLebanonLesothoLiberiaLibyaLithuaniaLow & middle incomeLow incomeLower middle incomeLuxembourgMacao SAR, ChinaMacedonia, FYRMadagascarMalawiMalaysiaMaldivesMaliMaltaMarshall IslandsMauritaniaMauritiusMexicoMicronesia, Fed. Sts.Middle East & North AfricaMiddle East & North Africa (excluding high income)Middle East & North Africa (IDA & IBRD countries)Middle incomeMoldovaMongoliaMoroccoMozambiqueMyanmarNamibiaNauruNepalNetherlandsNew CaledoniaNew ZealandNicaraguaNigerNigeriaNorth AmericaNorthern Mariana IslandsNorwayOECD membersOmanOther small statesPacific island small statesPakistanPalauPanamaPapua New GuineaParaguayPeruPhilippinesPolandPortugalPost-demographic dividendPre-demographic dividendPuerto RicoQatarRomaniaRussian FederationRwandaSamoaSao Tome and PrincipeSaudi ArabiaSenegalSerbiaSeychellesSierra LeoneSingaporeSlovak RepublicSloveniaSmall statesSolomon IslandsSomaliaSouth AfricaSouth AsiaSouth Asia (IDA & IBRD)SpainSri LankaSt. Kitts and NevisSt. LuciaSt. Vincent and the GrenadinesSub-Saharan Africa Sub-Saharan Africa (excluding high income)Sub-Saharan Africa (IDA & IBRD countries)SudanSurinameSwazilandSwedenSwitzerlandSyrian Arab RepublicTajikistanTanzaniaThailandTimor-LesteTogoTongaTrinidad and TobagoTunisiaTurkeyTurkmenistanTurks and Caicos IslandsTuvaluUgandaUkraineUnited Arab EmiratesUnited KingdomUnited StatesUpper middle incomeUruguayUzbekistanVanuatuVenezuela, RBVietnamVirgin Islands (U.S.)WorldYemen, Rep.ZambiaZimbabwe Timeline:
This timeline shows a graph from 1971 to 2009 of Turks and Caicos Islands. No data until 1970. Number of actual observations by date: 39.
Source name:
World Development Indicators
Source organization:
World Bank staff estimates from original source: European Commission, Joint Research Centre (JRC)/Netherlands Environmental Assessment Agency (PBL). Emission Database for Global Atmospheric Research (EDGAR): http://edgar.jrc.ec.europa.eu/.
Categories, topics:
Energy & Mining, Environment
Last updated:
apr 23, 2017
Indicators value changes by year
Minimum:
47.007
jan 1, 2002
Maximum:
66.205
jan 1, 1971
At the date of observation
Value
Absolute change
Change from previous value
jan 1, 1971
66.205
+66.205
0.0%
jan 1, 1972
66.016
-0.189
-0.29%
jan 1, 1973
65.719
-0.297
-0.45%
jan 1, 1974
65.742
+0.023
0.03%
jan 1, 1975
65.368
-0.374
-0.57%
jan 1, 1976
65.09
-0.278
-0.43%
jan 1, 1977
64.925
-0.165
-0.25%
jan 1, 1978
63.952
-0.973
-1.5%
jan 1, 1979
65.411
+1.46
2.28%
jan 1, 1980
65.052
-0.36
-0.55%
jan 1, 1981
64.536
-0.516
-0.79%
jan 1, 1982
64.826
+0.29
0.45%
jan 1, 1983
64.338
-0.489
-0.75%
jan 1, 1984
63.638
-0.7
-1.09%
jan 1, 1985
63.185
-0.453
-0.71%
jan 1, 1986
63.015
-0.169
-0.27%
jan 1, 1987
63.711
+0.696
1.1%
jan 1, 1988
63.324
-0.387
-0.61%
jan 1, 1989
59.892
-3.432
-5.42%
jan 1, 1990
59.553
-0.339
-0.57%
jan 1, 1991
60.092
+0.539
0.9%
jan 1, 1992
57.876
-2.216
-3.69%
jan 1, 1993
57.723
-0.153
-0.26%
jan 1, 1994
58.022
+0.299
0.52%
jan 1, 1995
58.662
+0.64
1.1%
jan 1, 1996
59.751
+1.088
1.86%
jan 1, 1997
61.273
+1.522
2.55%
jan 1, 1998
61.281
+0.009
0.01%
jan 1, 1999
61.551
+0.27
0.44%
jan 1, 2000
61.675
+0.124
0.2%
jan 1, 2001
61.779
+0.105
0.17%
jan 1, 2002
47.007
-14.772
-23.91%
jan 1, 2003
50.142
+3.135
6.67%
jan 1, 2004
52.305
+2.162
4.31%
jan 1, 2005
53.806
+1.502
2.87%
jan 1, 2006
54.876
+1.07
1.99%
jan 1, 2007
53.879
-0.997
-1.82%
jan 1, 2008
60.866
+6.987
12.97%
jan 1, 2009
60.673
-0.193
-0.32%
Ranking of countries by current statistics by years


Comments: