29
/
en
AIzaSyAYiBZKx7MnpbEhh9jyipgxe19OcubqV5w
April 1, 2024
83196
Belize
BLZ
true
2
1
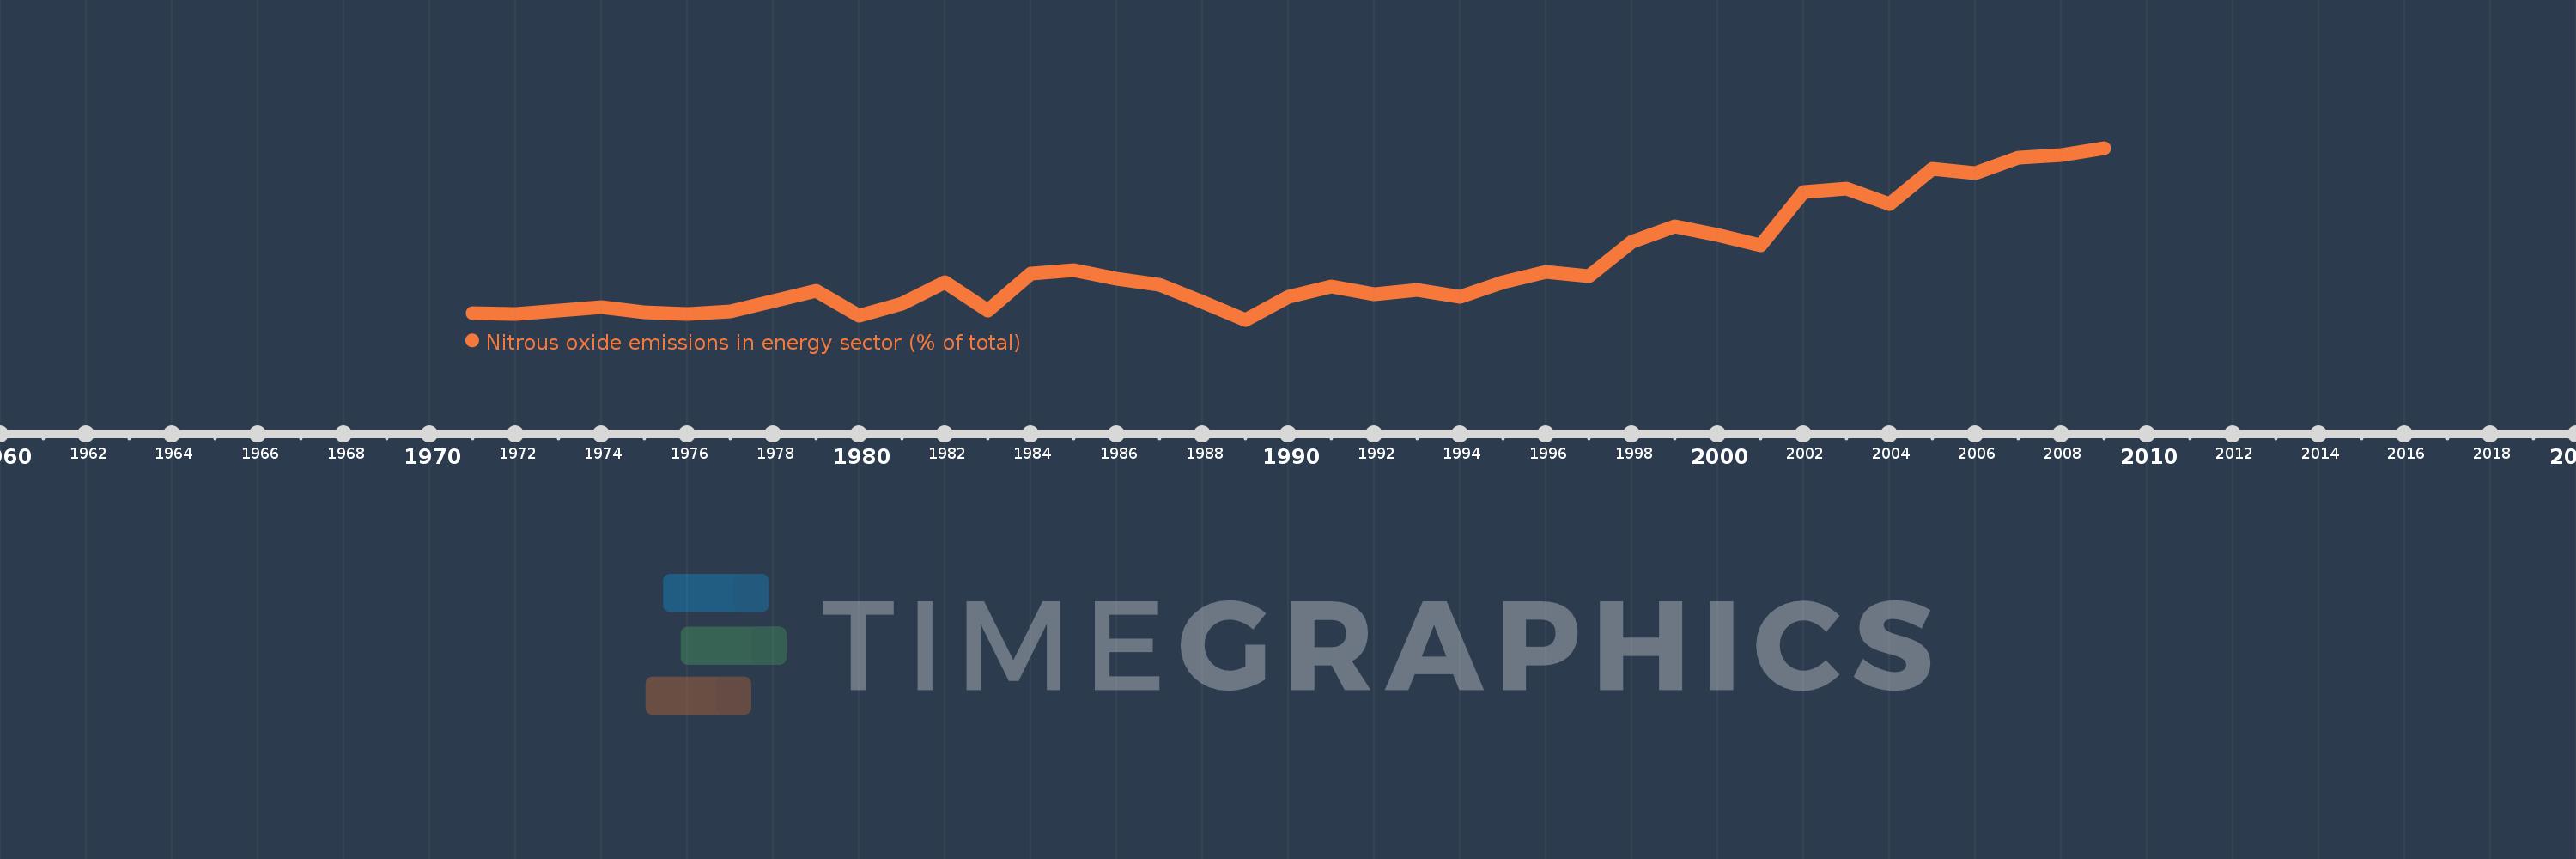
Nitrous oxide emissions in energy sector (% of total)
2009,2008,2007,2006,2005,2004,2003,2002,2001,2000,1999,1998,1997,1996,1995,1994,1993,1992,1991,1990,1989,1988,1987,1986,1985,1984,1983,1982,1981,1980,1979,1978,1977,1976,1975,1974,1973,1972,1971
This statistics in other country:
AfghanistanAlbaniaAlgeriaAmerican SamoaAndorraAngolaAntigua and BarbudaArab WorldArgentinaArmeniaArubaAustraliaAustriaAzerbaijanBahamas, TheBahrainBangladeshBarbadosBelarusBelgiumBelizeBeninBermudaBhutanBoliviaBosnia and HerzegovinaBotswanaBrazilBritish Virgin IslandsBrunei DarussalamBulgariaBurkina FasoBurundiCabo VerdeCambodiaCameroonCanadaCaribbean small statesCayman IslandsCentral African RepublicCentral Europe and the BalticsChadChileChinaColombiaComorosCongo, Dem. Rep.Congo, Rep.Costa RicaCote d'IvoireCroatiaCubaCyprusCzech RepublicDenmarkDjiboutiDominicaDominican RepublicEarly-demographic dividendEast Asia & PacificEast Asia & Pacific (excluding high income)East Asia & Pacific (IDA & IBRD countries)EcuadorEgypt, Arab Rep.El SalvadorEquatorial GuineaEritreaEstoniaEthiopiaEuro areaEurope & Central AsiaEurope & Central Asia (excluding high income)Europe & Central Asia (IDA & IBRD countries)European UnionFaroe IslandsFijiFinlandFragile and conflict affected situationsFranceFrench PolynesiaGabonGambia, TheGeorgiaGermanyGhanaGibraltarGreeceGreenlandGrenadaGuamGuatemalaGuineaGuinea-BissauGuyanaHaitiHeavily indebted poor countries (HIPC)High incomeHondurasHong Kong SAR, ChinaHungaryIBRD onlyIcelandIDA & IBRD totalIDA blendIDA onlyIDA totalIndiaIndonesiaIran, Islamic Rep.IraqIrelandIsraelItalyJamaicaJapanJordanKazakhstanKenyaKiribatiKorea, Dem. People’s Rep.Korea, Rep.KuwaitKyrgyz RepublicLao PDRLate-demographic dividendLatin America & Caribbean Latin America & Caribbean (excluding high income)Latin America & the Caribbean (IDA & IBRD countries)LatviaLeast developed countries: UN classificationLebanonLesothoLiberiaLibyaLithuaniaLow & middle incomeLow incomeLower middle incomeLuxembourgMacao SAR, ChinaMacedonia, FYRMadagascarMalawiMalaysiaMaldivesMaliMaltaMarshall IslandsMauritaniaMauritiusMexicoMicronesia, Fed. Sts.Middle East & North AfricaMiddle East & North Africa (excluding high income)Middle East & North Africa (IDA & IBRD countries)Middle incomeMoldovaMongoliaMoroccoMozambiqueMyanmarNamibiaNauruNepalNetherlandsNew CaledoniaNew ZealandNicaraguaNigerNigeriaNorth AmericaNorthern Mariana IslandsNorwayOECD membersOmanOther small statesPacific island small statesPakistanPalauPanamaPapua New GuineaParaguayPeruPhilippinesPolandPortugalPost-demographic dividendPre-demographic dividendPuerto RicoQatarRomaniaRussian FederationRwandaSamoaSao Tome and PrincipeSaudi ArabiaSenegalSerbiaSeychellesSierra LeoneSingaporeSlovak RepublicSloveniaSmall statesSolomon IslandsSomaliaSouth AfricaSouth AsiaSouth Asia (IDA & IBRD)SpainSri LankaSt. Kitts and NevisSt. LuciaSt. Vincent and the GrenadinesSub-Saharan Africa Sub-Saharan Africa (excluding high income)Sub-Saharan Africa (IDA & IBRD countries)SudanSurinameSwazilandSwedenSwitzerlandSyrian Arab RepublicTajikistanTanzaniaThailandTimor-LesteTogoTongaTrinidad and TobagoTunisiaTurkeyTurkmenistanTurks and Caicos IslandsTuvaluUgandaUkraineUnited Arab EmiratesUnited KingdomUnited StatesUpper middle incomeUruguayUzbekistanVanuatuVenezuela, RBVietnamVirgin Islands (U.S.)WorldYemen, Rep.ZambiaZimbabwe Timeline:
This timeline shows a graph from 1971 to 2009 of Belize. No data until 1970. Number of actual observations by date: 39.
Source name:
World Development Indicators
Source organization:
World Bank staff estimates from original source: European Commission, Joint Research Centre (JRC)/Netherlands Environmental Assessment Agency (PBL). Emission Database for Global Atmospheric Research (EDGAR): http://edgar.jrc.ec.europa.eu/.
Categories, topics:
Energy & Mining, Environment
Last updated:
apr 23, 2017
Indicators value changes by year
At the date of observation
Value
Absolute change
Change from previous value
jan 1, 1971
4.177
+4.177
0.0%
jan 1, 1972
4.162
-0.014
-0.34%
jan 1, 1973
4.258
+0.096
2.31%
jan 1, 1974
4.358
+0.099
2.33%
jan 1, 1975
4.198
-0.16
-3.67%
jan 1, 1976
4.159
-0.039
-0.92%
jan 1, 1977
4.234
+0.075
1.82%
jan 1, 1978
4.578
+0.343
8.11%
jan 1, 1979
4.89
+0.312
6.82%
jan 1, 1980
4.099
-0.791
-16.18%
jan 1, 1981
4.489
+0.39
9.52%
jan 1, 1982
5.174
+0.685
15.25%
jan 1, 1983
4.264
-0.909
-17.58%
jan 1, 1984
5.456
+1.192
27.95%
jan 1, 1985
5.548
+0.092
1.68%
jan 1, 1986
5.281
-0.267
-4.82%
jan 1, 1987
5.089
-0.192
-3.64%
jan 1, 1988
4.545
-0.544
-10.69%
jan 1, 1989
3.964
-0.58
-12.77%
jan 1, 1990
4.707
+0.743
18.74%
jan 1, 1991
5.028
+0.32
6.8%
jan 1, 1992
4.786
-0.241
-4.8%
jan 1, 1993
4.92
+0.133
2.79%
jan 1, 1994
4.695
-0.225
-4.57%
jan 1, 1995
5.187
+0.491
10.47%
jan 1, 1996
5.516
+0.33
6.36%
jan 1, 1997
5.371
-0.145
-2.63%
jan 1, 1998
6.48
+1.109
20.65%
jan 1, 1999
6.97
+0.49
7.55%
jan 1, 2000
6.707
-0.263
-3.78%
jan 1, 2001
6.352
-0.355
-5.29%
jan 1, 2002
8.082
+1.73
27.24%
jan 1, 2003
8.202
+0.12
1.49%
jan 1, 2004
7.686
-0.516
-6.29%
jan 1, 2005
8.817
+1.13
14.71%
jan 1, 2006
8.693
-0.124
-1.41%
jan 1, 2007
9.181
+0.489
5.62%
jan 1, 2008
9.265
+0.084
0.92%
jan 1, 2009
9.5
+0.235
2.54%
Ranking of countries by current statistics by years


Comments: