29
/
en
AIzaSyAYiBZKx7MnpbEhh9jyipgxe19OcubqV5w
April 1, 2024
66426
Algeria
DZA
true
2
1
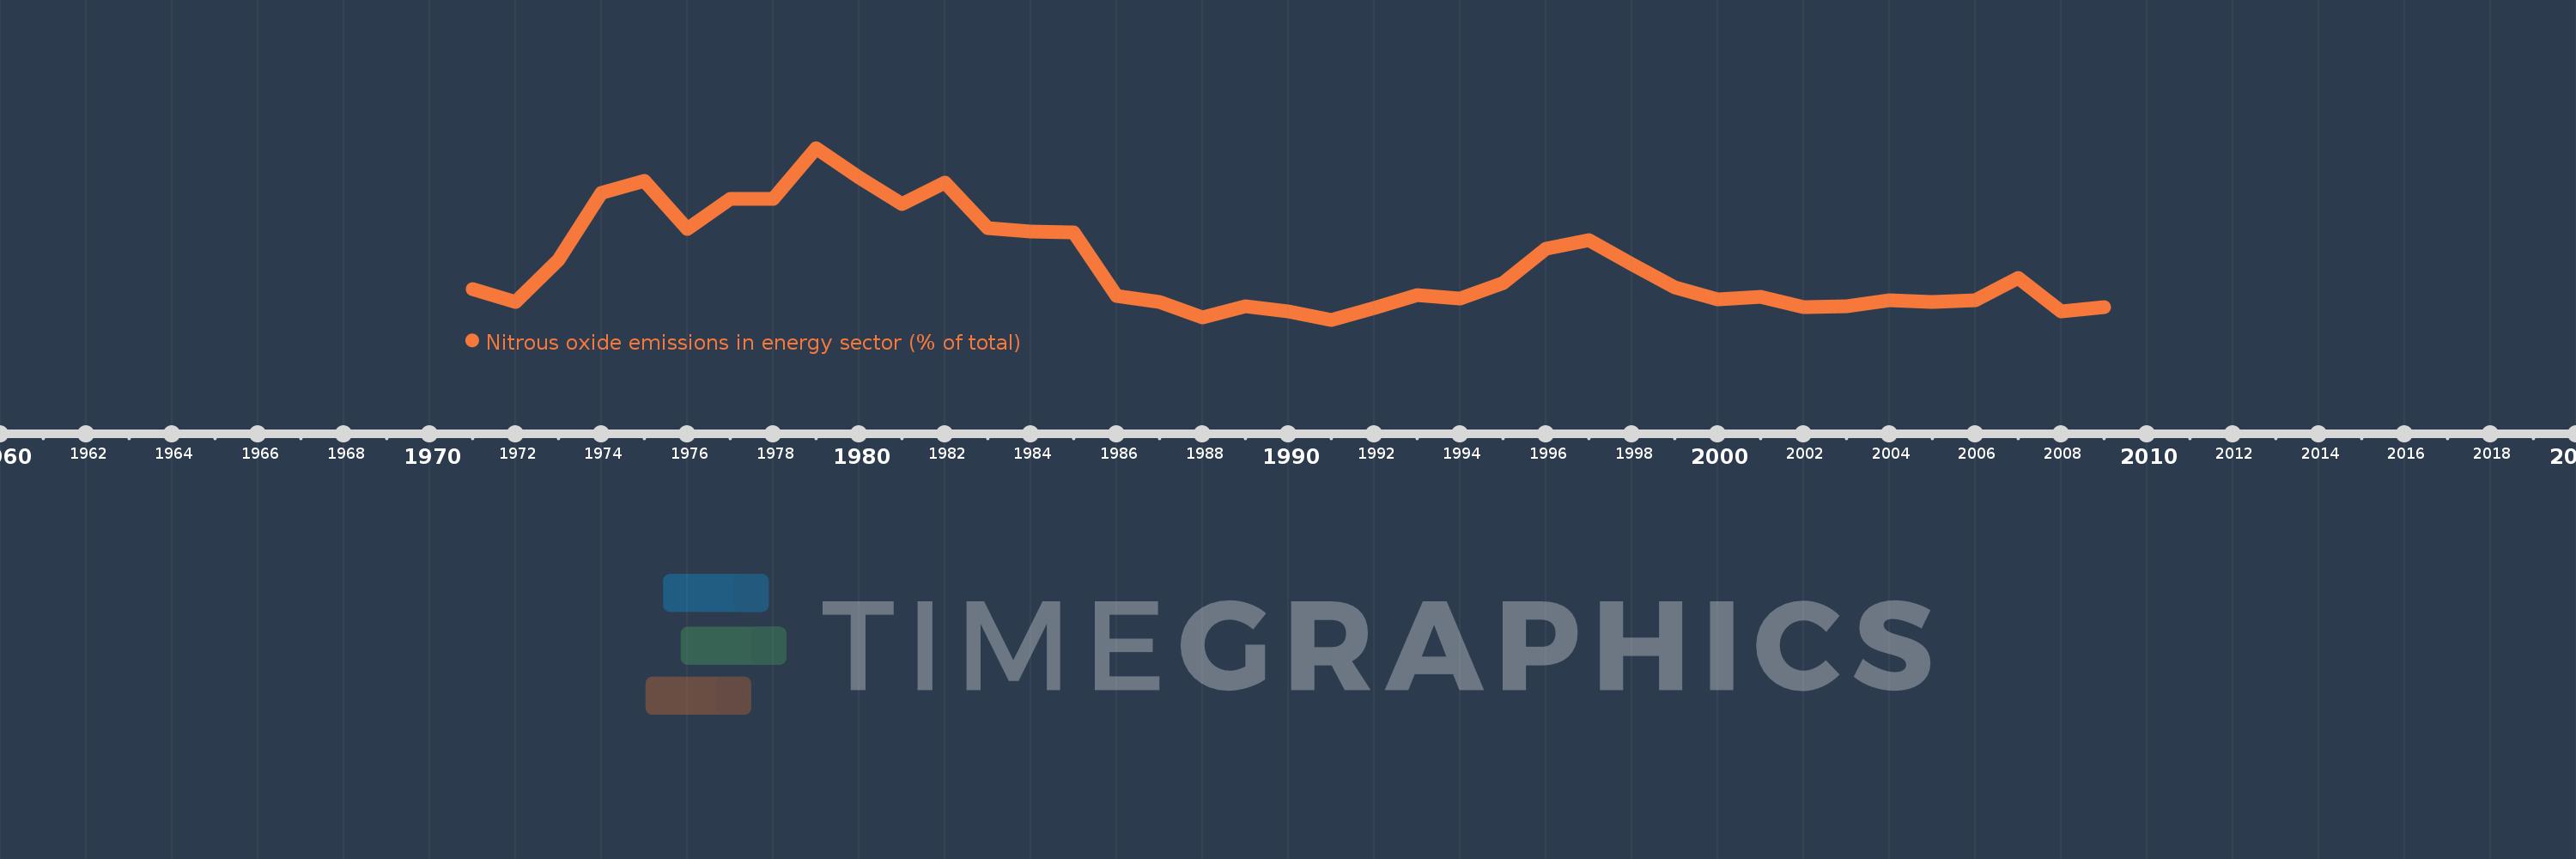
Nitrous oxide emissions in energy sector (% of total)
2009,2008,2007,2006,2005,2004,2003,2002,2001,2000,1999,1998,1997,1996,1995,1994,1993,1992,1991,1990,1989,1988,1987,1986,1985,1984,1983,1982,1981,1980,1979,1978,1977,1976,1975,1974,1973,1972,1971
This statistics in other country:
AfghanistanAlbaniaAlgeriaAmerican SamoaAndorraAngolaAntigua and BarbudaArab WorldArgentinaArmeniaArubaAustraliaAustriaAzerbaijanBahamas, TheBahrainBangladeshBarbadosBelarusBelgiumBelizeBeninBermudaBhutanBoliviaBosnia and HerzegovinaBotswanaBrazilBritish Virgin IslandsBrunei DarussalamBulgariaBurkina FasoBurundiCabo VerdeCambodiaCameroonCanadaCaribbean small statesCayman IslandsCentral African RepublicCentral Europe and the BalticsChadChileChinaColombiaComorosCongo, Dem. Rep.Congo, Rep.Costa RicaCote d'IvoireCroatiaCubaCyprusCzech RepublicDenmarkDjiboutiDominicaDominican RepublicEarly-demographic dividendEast Asia & PacificEast Asia & Pacific (excluding high income)East Asia & Pacific (IDA & IBRD countries)EcuadorEgypt, Arab Rep.El SalvadorEquatorial GuineaEritreaEstoniaEthiopiaEuro areaEurope & Central AsiaEurope & Central Asia (excluding high income)Europe & Central Asia (IDA & IBRD countries)European UnionFaroe IslandsFijiFinlandFragile and conflict affected situationsFranceFrench PolynesiaGabonGambia, TheGeorgiaGermanyGhanaGibraltarGreeceGreenlandGrenadaGuamGuatemalaGuineaGuinea-BissauGuyanaHaitiHeavily indebted poor countries (HIPC)High incomeHondurasHong Kong SAR, ChinaHungaryIBRD onlyIcelandIDA & IBRD totalIDA blendIDA onlyIDA totalIndiaIndonesiaIran, Islamic Rep.IraqIrelandIsraelItalyJamaicaJapanJordanKazakhstanKenyaKiribatiKorea, Dem. People’s Rep.Korea, Rep.KuwaitKyrgyz RepublicLao PDRLate-demographic dividendLatin America & Caribbean Latin America & Caribbean (excluding high income)Latin America & the Caribbean (IDA & IBRD countries)LatviaLeast developed countries: UN classificationLebanonLesothoLiberiaLibyaLithuaniaLow & middle incomeLow incomeLower middle incomeLuxembourgMacao SAR, ChinaMacedonia, FYRMadagascarMalawiMalaysiaMaldivesMaliMaltaMarshall IslandsMauritaniaMauritiusMexicoMicronesia, Fed. Sts.Middle East & North AfricaMiddle East & North Africa (excluding high income)Middle East & North Africa (IDA & IBRD countries)Middle incomeMoldovaMongoliaMoroccoMozambiqueMyanmarNamibiaNauruNepalNetherlandsNew CaledoniaNew ZealandNicaraguaNigerNigeriaNorth AmericaNorthern Mariana IslandsNorwayOECD membersOmanOther small statesPacific island small statesPakistanPalauPanamaPapua New GuineaParaguayPeruPhilippinesPolandPortugalPost-demographic dividendPre-demographic dividendPuerto RicoQatarRomaniaRussian FederationRwandaSamoaSao Tome and PrincipeSaudi ArabiaSenegalSerbiaSeychellesSierra LeoneSingaporeSlovak RepublicSloveniaSmall statesSolomon IslandsSomaliaSouth AfricaSouth AsiaSouth Asia (IDA & IBRD)SpainSri LankaSt. Kitts and NevisSt. LuciaSt. Vincent and the GrenadinesSub-Saharan Africa Sub-Saharan Africa (excluding high income)Sub-Saharan Africa (IDA & IBRD countries)SudanSurinameSwazilandSwedenSwitzerlandSyrian Arab RepublicTajikistanTanzaniaThailandTimor-LesteTogoTongaTrinidad and TobagoTunisiaTurkeyTurkmenistanTurks and Caicos IslandsTuvaluUgandaUkraineUnited Arab EmiratesUnited KingdomUnited StatesUpper middle incomeUruguayUzbekistanVanuatuVenezuela, RBVietnamVirgin Islands (U.S.)WorldYemen, Rep.ZambiaZimbabwe Timeline:
This timeline shows a graph from 1971 to 2009 of Algeria. No data until 1970. Number of actual observations by date: 39.
Source name:
World Development Indicators
Source organization:
World Bank staff estimates from original source: European Commission, Joint Research Centre (JRC)/Netherlands Environmental Assessment Agency (PBL). Emission Database for Global Atmospheric Research (EDGAR): http://edgar.jrc.ec.europa.eu/.
Categories, topics:
Energy & Mining, Environment
Last updated:
apr 23, 2017
Indicators value changes by year
Maximum:
13.158
jan 1, 1979
At the date of observation
Value
Absolute change
Change from previous value
jan 1, 1971
7.903
+7.903
0.0%
jan 1, 1972
7.426
-0.477
-6.04%
jan 1, 1973
8.975
+1.55
20.87%
jan 1, 1974
11.496
+2.52
28.08%
jan 1, 1975
11.946
+0.45
3.92%
jan 1, 1976
10.131
-1.815
-15.19%
jan 1, 1977
11.261
+1.13
11.15%
jan 1, 1978
11.248
-0.013
-0.11%
jan 1, 1979
13.158
+1.91
16.98%
jan 1, 1980
12.053
-1.105
-8.4%
jan 1, 1981
11.067
-0.986
-8.18%
jan 1, 1982
11.864
+0.797
7.2%
jan 1, 1983
10.168
-1.696
-14.29%
jan 1, 1984
10.052
-0.116
-1.14%
jan 1, 1985
9.994
-0.058
-0.57%
jan 1, 1986
7.622
-2.372
-23.73%
jan 1, 1987
7.397
-0.226
-2.96%
jan 1, 1988
6.821
-0.576
-7.78%
jan 1, 1989
7.255
+0.434
6.37%
jan 1, 1990
7.068
-0.187
-2.58%
jan 1, 1991
6.749
-0.319
-4.52%
jan 1, 1992
7.195
+0.446
6.6%
jan 1, 1993
7.671
+0.477
6.62%
jan 1, 1994
7.536
-0.136
-1.77%
jan 1, 1995
8.129
+0.593
7.87%
jan 1, 1996
9.402
+1.273
15.66%
jan 1, 1997
9.711
+0.309
3.29%
jan 1, 1998
8.824
-0.887
-9.13%
jan 1, 1999
7.943
-0.881
-9.98%
jan 1, 2000
7.506
-0.436
-5.49%
jan 1, 2001
7.592
+0.086
1.15%
jan 1, 2002
7.222
-0.371
-4.88%
jan 1, 2003
7.258
+0.037
0.51%
jan 1, 2004
7.489
+0.23
3.17%
jan 1, 2005
7.409
-0.079
-1.06%
jan 1, 2006
7.486
+0.076
1.03%
jan 1, 2007
8.311
+0.826
11.03%
jan 1, 2008
7.072
-1.239
-14.91%
jan 1, 2009
7.227
+0.155
2.19%
Ranking of countries by current statistics by years


Comments: