29
/
en
AIzaSyAYiBZKx7MnpbEhh9jyipgxe19OcubqV5w
April 1, 2024
226236
Portugal
PRT
true
2
1
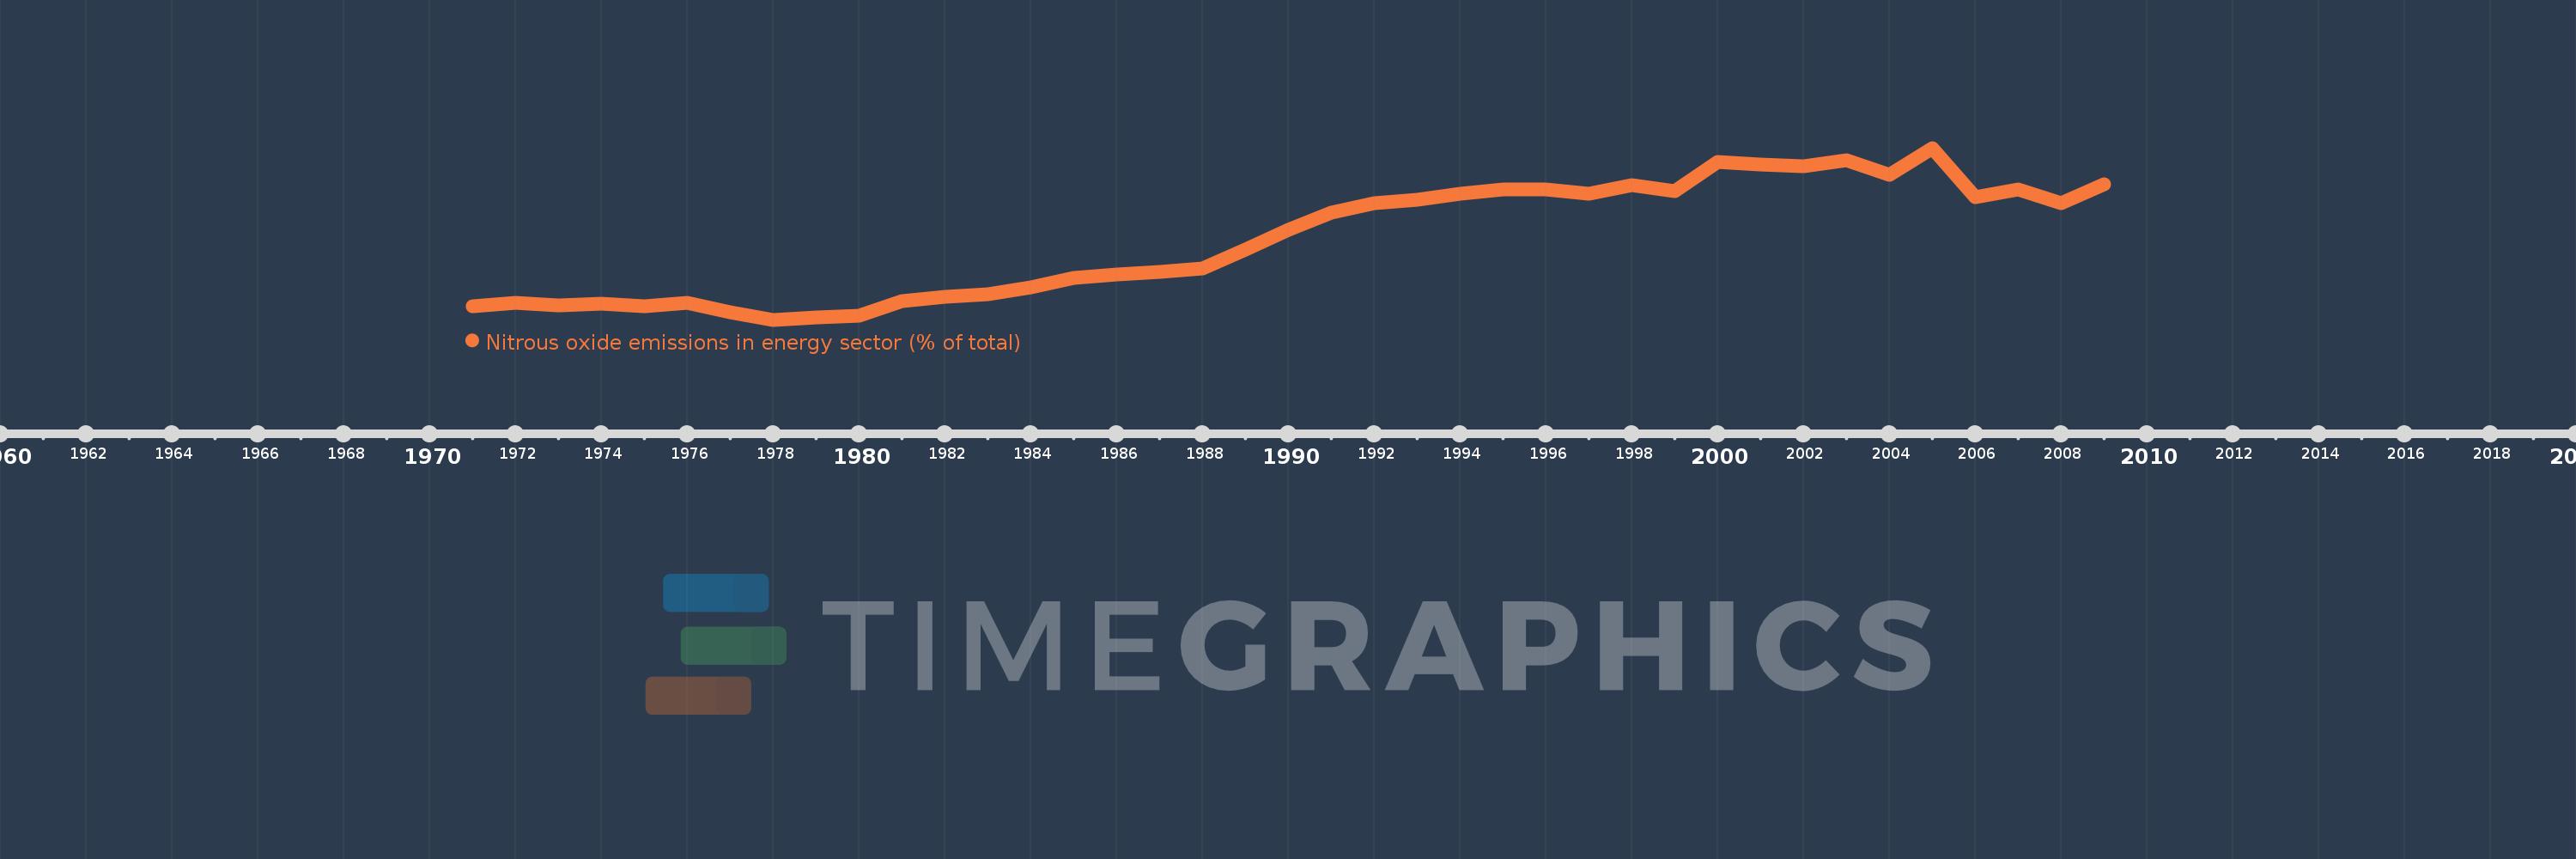
Nitrous oxide emissions in energy sector (% of total)
2009,2008,2007,2006,2005,2004,2003,2002,2001,2000,1999,1998,1997,1996,1995,1994,1993,1992,1991,1990,1989,1988,1987,1986,1985,1984,1983,1982,1981,1980,1979,1978,1977,1976,1975,1974,1973,1972,1971
This statistics in other country:
AfghanistanAlbaniaAlgeriaAmerican SamoaAndorraAngolaAntigua and BarbudaArab WorldArgentinaArmeniaArubaAustraliaAustriaAzerbaijanBahamas, TheBahrainBangladeshBarbadosBelarusBelgiumBelizeBeninBermudaBhutanBoliviaBosnia and HerzegovinaBotswanaBrazilBritish Virgin IslandsBrunei DarussalamBulgariaBurkina FasoBurundiCabo VerdeCambodiaCameroonCanadaCaribbean small statesCayman IslandsCentral African RepublicCentral Europe and the BalticsChadChileChinaColombiaComorosCongo, Dem. Rep.Congo, Rep.Costa RicaCote d'IvoireCroatiaCubaCyprusCzech RepublicDenmarkDjiboutiDominicaDominican RepublicEarly-demographic dividendEast Asia & PacificEast Asia & Pacific (excluding high income)East Asia & Pacific (IDA & IBRD countries)EcuadorEgypt, Arab Rep.El SalvadorEquatorial GuineaEritreaEstoniaEthiopiaEuro areaEurope & Central AsiaEurope & Central Asia (excluding high income)Europe & Central Asia (IDA & IBRD countries)European UnionFaroe IslandsFijiFinlandFragile and conflict affected situationsFranceFrench PolynesiaGabonGambia, TheGeorgiaGermanyGhanaGibraltarGreeceGreenlandGrenadaGuamGuatemalaGuineaGuinea-BissauGuyanaHaitiHeavily indebted poor countries (HIPC)High incomeHondurasHong Kong SAR, ChinaHungaryIBRD onlyIcelandIDA & IBRD totalIDA blendIDA onlyIDA totalIndiaIndonesiaIran, Islamic Rep.IraqIrelandIsraelItalyJamaicaJapanJordanKazakhstanKenyaKiribatiKorea, Dem. People’s Rep.Korea, Rep.KuwaitKyrgyz RepublicLao PDRLate-demographic dividendLatin America & Caribbean Latin America & Caribbean (excluding high income)Latin America & the Caribbean (IDA & IBRD countries)LatviaLeast developed countries: UN classificationLebanonLesothoLiberiaLibyaLithuaniaLow & middle incomeLow incomeLower middle incomeLuxembourgMacao SAR, ChinaMacedonia, FYRMadagascarMalawiMalaysiaMaldivesMaliMaltaMarshall IslandsMauritaniaMauritiusMexicoMicronesia, Fed. Sts.Middle East & North AfricaMiddle East & North Africa (excluding high income)Middle East & North Africa (IDA & IBRD countries)Middle incomeMoldovaMongoliaMoroccoMozambiqueMyanmarNamibiaNauruNepalNetherlandsNew CaledoniaNew ZealandNicaraguaNigerNigeriaNorth AmericaNorthern Mariana IslandsNorwayOECD membersOmanOther small statesPacific island small statesPakistanPalauPanamaPapua New GuineaParaguayPeruPhilippinesPolandPortugalPost-demographic dividendPre-demographic dividendPuerto RicoQatarRomaniaRussian FederationRwandaSamoaSao Tome and PrincipeSaudi ArabiaSenegalSerbiaSeychellesSierra LeoneSingaporeSlovak RepublicSloveniaSmall statesSolomon IslandsSomaliaSouth AfricaSouth AsiaSouth Asia (IDA & IBRD)SpainSri LankaSt. Kitts and NevisSt. LuciaSt. Vincent and the GrenadinesSub-Saharan Africa Sub-Saharan Africa (excluding high income)Sub-Saharan Africa (IDA & IBRD countries)SudanSurinameSwazilandSwedenSwitzerlandSyrian Arab RepublicTajikistanTanzaniaThailandTimor-LesteTogoTongaTrinidad and TobagoTunisiaTurkeyTurkmenistanTurks and Caicos IslandsTuvaluUgandaUkraineUnited Arab EmiratesUnited KingdomUnited StatesUpper middle incomeUruguayUzbekistanVanuatuVenezuela, RBVietnamVirgin Islands (U.S.)WorldYemen, Rep.ZambiaZimbabwe Timeline:
This timeline shows a graph from 1971 to 2009 of Portugal. No data until 1970. Number of actual observations by date: 39.
Source name:
World Development Indicators
Source organization:
World Bank staff estimates from original source: European Commission, Joint Research Centre (JRC)/Netherlands Environmental Assessment Agency (PBL). Emission Database for Global Atmospheric Research (EDGAR): http://edgar.jrc.ec.europa.eu/.
Categories, topics:
Energy & Mining, Environment
Last updated:
apr 23, 2017
Indicators value changes by year
At the date of observation
Value
Absolute change
Change from previous value
jan 1, 1971
4.943
+4.943
0.0%
jan 1, 1972
5.106
+0.163
3.29%
jan 1, 1973
4.986
-0.12
-2.35%
jan 1, 1974
5.093
+0.108
2.16%
jan 1, 1975
4.959
-0.134
-2.63%
jan 1, 1976
5.107
+0.148
2.98%
jan 1, 1977
4.664
-0.443
-8.68%
jan 1, 1978
4.286
-0.377
-8.09%
jan 1, 1979
4.412
+0.126
2.93%
jan 1, 1980
4.49
+0.078
1.77%
jan 1, 1981
5.232
+0.742
16.53%
jan 1, 1982
5.423
+0.19
3.64%
jan 1, 1983
5.543
+0.12
2.22%
jan 1, 1984
5.877
+0.334
6.02%
jan 1, 1985
6.347
+0.47
8.0%
jan 1, 1986
6.514
+0.167
2.64%
jan 1, 1987
6.643
+0.129
1.98%
jan 1, 1988
6.831
+0.188
2.83%
jan 1, 1989
7.748
+0.917
13.42%
jan 1, 1990
8.766
+1.018
13.14%
jan 1, 1991
9.602
+0.835
9.53%
jan 1, 1992
10.056
+0.454
4.73%
jan 1, 1993
10.244
+0.188
1.87%
jan 1, 1994
10.519
+0.275
2.69%
jan 1, 1995
10.757
+0.239
2.27%
jan 1, 1996
10.743
-0.014
-0.13%
jan 1, 1997
10.557
-0.186
-1.73%
jan 1, 1998
10.981
+0.424
4.02%
jan 1, 1999
10.675
-0.306
-2.79%
jan 1, 2000
12.104
+1.429
13.38%
jan 1, 2001
11.987
-0.116
-0.96%
jan 1, 2002
11.901
-0.086
-0.72%
jan 1, 2003
12.212
+0.311
2.61%
jan 1, 2004
11.476
-0.736
-6.03%
jan 1, 2005
12.81
+1.334
11.63%
jan 1, 2006
10.367
-2.443
-19.07%
jan 1, 2007
10.746
+0.379
3.65%
jan 1, 2008
10.073
-0.673
-6.26%
jan 1, 2009
10.991
+0.918
9.11%
Ranking of countries by current statistics by years


Comments: