29
/
en
AIzaSyAYiBZKx7MnpbEhh9jyipgxe19OcubqV5w
April 1, 2024
121289
Dominica
DMA
true
2
1
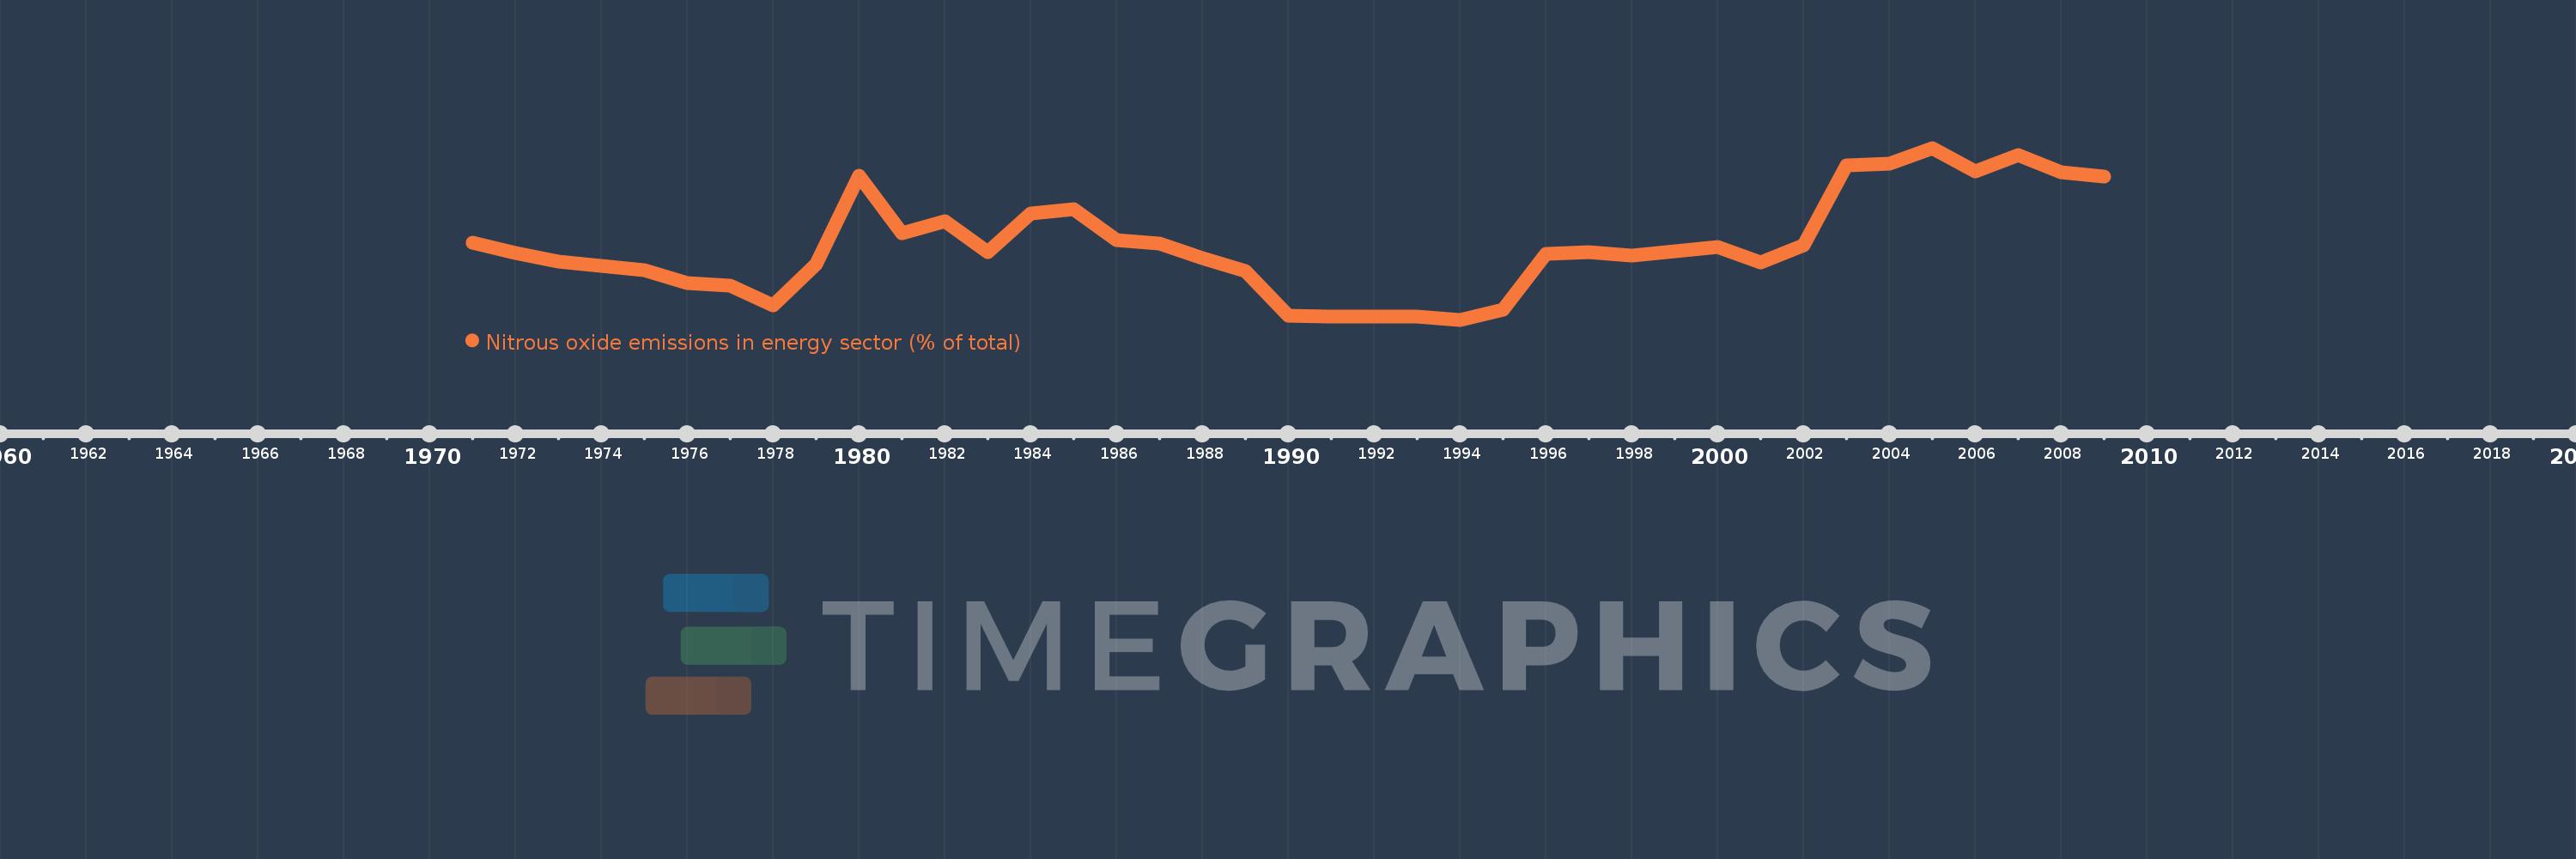
Nitrous oxide emissions in energy sector (% of total)
2009,2008,2007,2006,2005,2004,2003,2002,2001,2000,1999,1998,1997,1996,1995,1994,1993,1992,1991,1990,1989,1988,1987,1986,1985,1984,1983,1982,1981,1980,1979,1978,1977,1976,1975,1974,1973,1972,1971
This statistics in other country:
AfghanistanAlbaniaAlgeriaAmerican SamoaAndorraAngolaAntigua and BarbudaArab WorldArgentinaArmeniaArubaAustraliaAustriaAzerbaijanBahamas, TheBahrainBangladeshBarbadosBelarusBelgiumBelizeBeninBermudaBhutanBoliviaBosnia and HerzegovinaBotswanaBrazilBritish Virgin IslandsBrunei DarussalamBulgariaBurkina FasoBurundiCabo VerdeCambodiaCameroonCanadaCaribbean small statesCayman IslandsCentral African RepublicCentral Europe and the BalticsChadChileChinaColombiaComorosCongo, Dem. Rep.Congo, Rep.Costa RicaCote d'IvoireCroatiaCubaCyprusCzech RepublicDenmarkDjiboutiDominicaDominican RepublicEarly-demographic dividendEast Asia & PacificEast Asia & Pacific (excluding high income)East Asia & Pacific (IDA & IBRD countries)EcuadorEgypt, Arab Rep.El SalvadorEquatorial GuineaEritreaEstoniaEthiopiaEuro areaEurope & Central AsiaEurope & Central Asia (excluding high income)Europe & Central Asia (IDA & IBRD countries)European UnionFaroe IslandsFijiFinlandFragile and conflict affected situationsFranceFrench PolynesiaGabonGambia, TheGeorgiaGermanyGhanaGibraltarGreeceGreenlandGrenadaGuamGuatemalaGuineaGuinea-BissauGuyanaHaitiHeavily indebted poor countries (HIPC)High incomeHondurasHong Kong SAR, ChinaHungaryIBRD onlyIcelandIDA & IBRD totalIDA blendIDA onlyIDA totalIndiaIndonesiaIran, Islamic Rep.IraqIrelandIsraelItalyJamaicaJapanJordanKazakhstanKenyaKiribatiKorea, Dem. People’s Rep.Korea, Rep.KuwaitKyrgyz RepublicLao PDRLate-demographic dividendLatin America & Caribbean Latin America & Caribbean (excluding high income)Latin America & the Caribbean (IDA & IBRD countries)LatviaLeast developed countries: UN classificationLebanonLesothoLiberiaLibyaLithuaniaLow & middle incomeLow incomeLower middle incomeLuxembourgMacao SAR, ChinaMacedonia, FYRMadagascarMalawiMalaysiaMaldivesMaliMaltaMarshall IslandsMauritaniaMauritiusMexicoMicronesia, Fed. Sts.Middle East & North AfricaMiddle East & North Africa (excluding high income)Middle East & North Africa (IDA & IBRD countries)Middle incomeMoldovaMongoliaMoroccoMozambiqueMyanmarNamibiaNauruNepalNetherlandsNew CaledoniaNew ZealandNicaraguaNigerNigeriaNorth AmericaNorthern Mariana IslandsNorwayOECD membersOmanOther small statesPacific island small statesPakistanPalauPanamaPapua New GuineaParaguayPeruPhilippinesPolandPortugalPost-demographic dividendPre-demographic dividendPuerto RicoQatarRomaniaRussian FederationRwandaSamoaSao Tome and PrincipeSaudi ArabiaSenegalSerbiaSeychellesSierra LeoneSingaporeSlovak RepublicSloveniaSmall statesSolomon IslandsSomaliaSouth AfricaSouth AsiaSouth Asia (IDA & IBRD)SpainSri LankaSt. Kitts and NevisSt. LuciaSt. Vincent and the GrenadinesSub-Saharan Africa Sub-Saharan Africa (excluding high income)Sub-Saharan Africa (IDA & IBRD countries)SudanSurinameSwazilandSwedenSwitzerlandSyrian Arab RepublicTajikistanTanzaniaThailandTimor-LesteTogoTongaTrinidad and TobagoTunisiaTurkeyTurkmenistanTurks and Caicos IslandsTuvaluUgandaUkraineUnited Arab EmiratesUnited KingdomUnited StatesUpper middle incomeUruguayUzbekistanVanuatuVenezuela, RBVietnamVirgin Islands (U.S.)WorldYemen, Rep.ZambiaZimbabwe Timeline:
This timeline shows a graph from 1971 to 2009 of Dominica. No data until 1970. Number of actual observations by date: 39.
Source name:
World Development Indicators
Source organization:
World Bank staff estimates from original source: European Commission, Joint Research Centre (JRC)/Netherlands Environmental Assessment Agency (PBL). Emission Database for Global Atmospheric Research (EDGAR): http://edgar.jrc.ec.europa.eu/.
Categories, topics:
Energy & Mining, Environment
Last updated:
apr 23, 2017
Indicators value changes by year
At the date of observation
Value
Absolute change
Change from previous value
jan 1, 1971
4.24
+4.24
0.0%
jan 1, 1972
4.021
-0.219
-5.17%
jan 1, 1973
3.846
-0.175
-4.34%
jan 1, 1974
3.743
-0.103
-2.68%
jan 1, 1975
3.662
-0.081
-2.18%
jan 1, 1976
3.381
-0.28
-7.66%
jan 1, 1977
3.316
-0.065
-1.93%
jan 1, 1978
2.887
-0.429
-12.94%
jan 1, 1979
3.786
+0.899
31.15%
jan 1, 1980
5.691
+1.905
50.31%
jan 1, 1981
4.454
-1.238
-21.75%
jan 1, 1982
4.713
+0.259
5.82%
jan 1, 1983
4.043
-0.67
-14.21%
jan 1, 1984
4.881
+0.838
20.72%
jan 1, 1985
4.973
+0.092
1.88%
jan 1, 1986
4.309
-0.664
-13.36%
jan 1, 1987
4.235
-0.074
-1.71%
jan 1, 1988
3.917
-0.318
-7.51%
jan 1, 1989
3.627
-0.29
-7.41%
jan 1, 1990
2.662
-0.965
-26.62%
jan 1, 1991
2.657
-0.004
-0.16%
jan 1, 1992
2.649
-0.009
-0.33%
jan 1, 1993
2.657
+0.009
0.32%
jan 1, 1994
2.582
-0.075
-2.82%
jan 1, 1995
2.8
+0.218
8.45%
jan 1, 1996
4.011
+1.211
43.24%
jan 1, 1997
4.037
+0.026
0.65%
jan 1, 1998
3.972
-0.065
-1.62%
jan 1, 1999
4.056
+0.084
2.12%
jan 1, 2000
4.149
+0.093
2.29%
jan 1, 2001
3.818
-0.331
-7.98%
jan 1, 2002
4.189
+0.372
9.73%
jan 1, 2003
5.928
+1.738
41.49%
jan 1, 2004
5.963
+0.035
0.6%
jan 1, 2005
6.296
+0.333
5.58%
jan 1, 2006
5.782
-0.513
-8.16%
jan 1, 2007
6.146
+0.364
6.29%
jan 1, 2008
5.764
-0.382
-6.21%
jan 1, 2009
5.67
-0.094
-1.62%
Ranking of countries by current statistics by years


Comments: