29
/
en
AIzaSyAYiBZKx7MnpbEhh9jyipgxe19OcubqV5w
April 1, 2024
133468
Finland
FIN
true
2
1
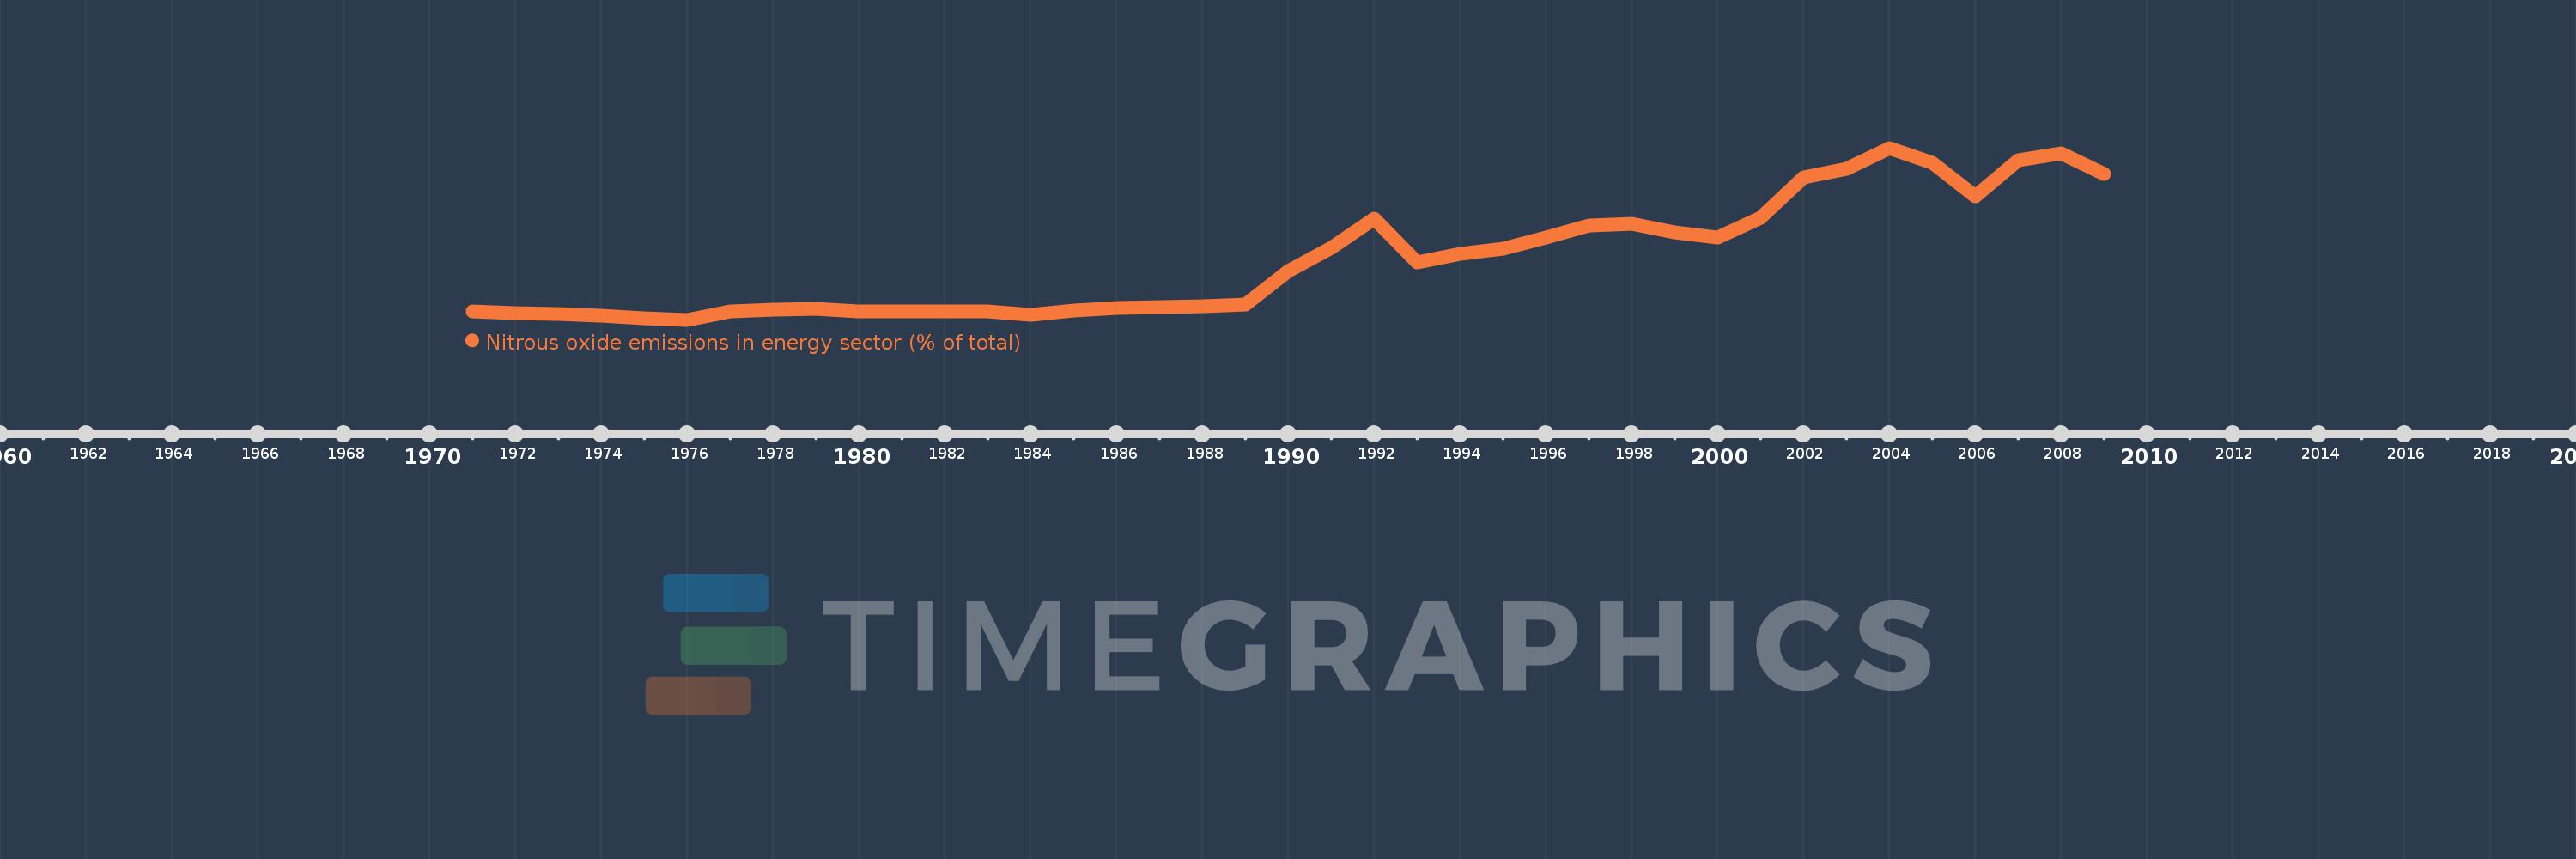
Nitrous oxide emissions in energy sector (% of total)
2009,2008,2007,2006,2005,2004,2003,2002,2001,2000,1999,1998,1997,1996,1995,1994,1993,1992,1991,1990,1989,1988,1987,1986,1985,1984,1983,1982,1981,1980,1979,1978,1977,1976,1975,1974,1973,1972,1971
This statistics in other country:
AfghanistanAlbaniaAlgeriaAmerican SamoaAndorraAngolaAntigua and BarbudaArab WorldArgentinaArmeniaArubaAustraliaAustriaAzerbaijanBahamas, TheBahrainBangladeshBarbadosBelarusBelgiumBelizeBeninBermudaBhutanBoliviaBosnia and HerzegovinaBotswanaBrazilBritish Virgin IslandsBrunei DarussalamBulgariaBurkina FasoBurundiCabo VerdeCambodiaCameroonCanadaCaribbean small statesCayman IslandsCentral African RepublicCentral Europe and the BalticsChadChileChinaColombiaComorosCongo, Dem. Rep.Congo, Rep.Costa RicaCote d'IvoireCroatiaCubaCyprusCzech RepublicDenmarkDjiboutiDominicaDominican RepublicEarly-demographic dividendEast Asia & PacificEast Asia & Pacific (excluding high income)East Asia & Pacific (IDA & IBRD countries)EcuadorEgypt, Arab Rep.El SalvadorEquatorial GuineaEritreaEstoniaEthiopiaEuro areaEurope & Central AsiaEurope & Central Asia (excluding high income)Europe & Central Asia (IDA & IBRD countries)European UnionFaroe IslandsFijiFinlandFragile and conflict affected situationsFranceFrench PolynesiaGabonGambia, TheGeorgiaGermanyGhanaGibraltarGreeceGreenlandGrenadaGuamGuatemalaGuineaGuinea-BissauGuyanaHaitiHeavily indebted poor countries (HIPC)High incomeHondurasHong Kong SAR, ChinaHungaryIBRD onlyIcelandIDA & IBRD totalIDA blendIDA onlyIDA totalIndiaIndonesiaIran, Islamic Rep.IraqIrelandIsraelItalyJamaicaJapanJordanKazakhstanKenyaKiribatiKorea, Dem. People’s Rep.Korea, Rep.KuwaitKyrgyz RepublicLao PDRLate-demographic dividendLatin America & Caribbean Latin America & Caribbean (excluding high income)Latin America & the Caribbean (IDA & IBRD countries)LatviaLeast developed countries: UN classificationLebanonLesothoLiberiaLibyaLithuaniaLow & middle incomeLow incomeLower middle incomeLuxembourgMacao SAR, ChinaMacedonia, FYRMadagascarMalawiMalaysiaMaldivesMaliMaltaMarshall IslandsMauritaniaMauritiusMexicoMicronesia, Fed. Sts.Middle East & North AfricaMiddle East & North Africa (excluding high income)Middle East & North Africa (IDA & IBRD countries)Middle incomeMoldovaMongoliaMoroccoMozambiqueMyanmarNamibiaNauruNepalNetherlandsNew CaledoniaNew ZealandNicaraguaNigerNigeriaNorth AmericaNorthern Mariana IslandsNorwayOECD membersOmanOther small statesPacific island small statesPakistanPalauPanamaPapua New GuineaParaguayPeruPhilippinesPolandPortugalPost-demographic dividendPre-demographic dividendPuerto RicoQatarRomaniaRussian FederationRwandaSamoaSao Tome and PrincipeSaudi ArabiaSenegalSerbiaSeychellesSierra LeoneSingaporeSlovak RepublicSloveniaSmall statesSolomon IslandsSomaliaSouth AfricaSouth AsiaSouth Asia (IDA & IBRD)SpainSri LankaSt. Kitts and NevisSt. LuciaSt. Vincent and the GrenadinesSub-Saharan Africa Sub-Saharan Africa (excluding high income)Sub-Saharan Africa (IDA & IBRD countries)SudanSurinameSwazilandSwedenSwitzerlandSyrian Arab RepublicTajikistanTanzaniaThailandTimor-LesteTogoTongaTrinidad and TobagoTunisiaTurkeyTurkmenistanTurks and Caicos IslandsTuvaluUgandaUkraineUnited Arab EmiratesUnited KingdomUnited StatesUpper middle incomeUruguayUzbekistanVanuatuVenezuela, RBVietnamVirgin Islands (U.S.)WorldYemen, Rep.ZambiaZimbabwe Timeline:
This timeline shows a graph from 1971 to 2009 of Finland. No data until 1970. Number of actual observations by date: 39.
Source name:
World Development Indicators
Source organization:
World Bank staff estimates from original source: European Commission, Joint Research Centre (JRC)/Netherlands Environmental Assessment Agency (PBL). Emission Database for Global Atmospheric Research (EDGAR): http://edgar.jrc.ec.europa.eu/.
Categories, topics:
Energy & Mining, Environment
Last updated:
apr 23, 2017
Indicators value changes by year
Maximum:
32.512
jan 1, 2004
At the date of observation
Value
Absolute change
Change from previous value
jan 1, 1971
8.201
+8.201
0.0%
jan 1, 1972
7.959
-0.242
-2.96%
jan 1, 1973
7.775
-0.184
-2.31%
jan 1, 1974
7.554
-0.221
-2.85%
jan 1, 1975
7.142
-0.411
-5.44%
jan 1, 1976
6.959
-0.183
-2.57%
jan 1, 1977
8.233
+1.274
18.3%
jan 1, 1978
8.512
+0.279
3.39%
jan 1, 1979
8.527
+0.015
0.17%
jan 1, 1980
8.258
-0.269
-3.15%
jan 1, 1981
8.16
-0.098
-1.19%
jan 1, 1982
8.168
+0.009
0.11%
jan 1, 1983
8.152
-0.017
-0.2%
jan 1, 1984
7.745
-0.407
-4.99%
jan 1, 1985
8.286
+0.542
6.99%
jan 1, 1986
8.765
+0.479
5.78%
jan 1, 1987
8.823
+0.058
0.66%
jan 1, 1988
8.965
+0.142
1.61%
jan 1, 1989
9.279
+0.314
3.5%
jan 1, 1990
14.217
+4.938
53.22%
jan 1, 1991
17.68
+3.463
24.36%
jan 1, 1992
22.016
+4.336
24.53%
jan 1, 1993
15.492
-6.524
-29.63%
jan 1, 1994
16.77
+1.278
8.25%
jan 1, 1995
17.479
+0.709
4.23%
jan 1, 1996
19.198
+1.718
9.83%
jan 1, 1997
20.939
+1.741
9.07%
jan 1, 1998
21.283
+0.345
1.65%
jan 1, 1999
20.011
-1.272
-5.98%
jan 1, 2000
19.206
-0.805
-4.02%
jan 1, 2001
22.064
+2.858
14.88%
jan 1, 2002
28.184
+6.12
27.74%
jan 1, 2003
29.388
+1.204
4.27%
jan 1, 2004
32.512
+3.124
10.63%
jan 1, 2005
30.317
-2.195
-6.75%
jan 1, 2006
25.304
-5.013
-16.54%
jan 1, 2007
30.715
+5.411
21.38%
jan 1, 2008
31.77
+1.055
3.43%
jan 1, 2009
28.662
-3.108
-9.78%
Ranking of countries by current statistics by years


Comments: