29
/
en
AIzaSyAYiBZKx7MnpbEhh9jyipgxe19OcubqV5w
April 1, 2024
179254
Liberia
LBR
true
2
1
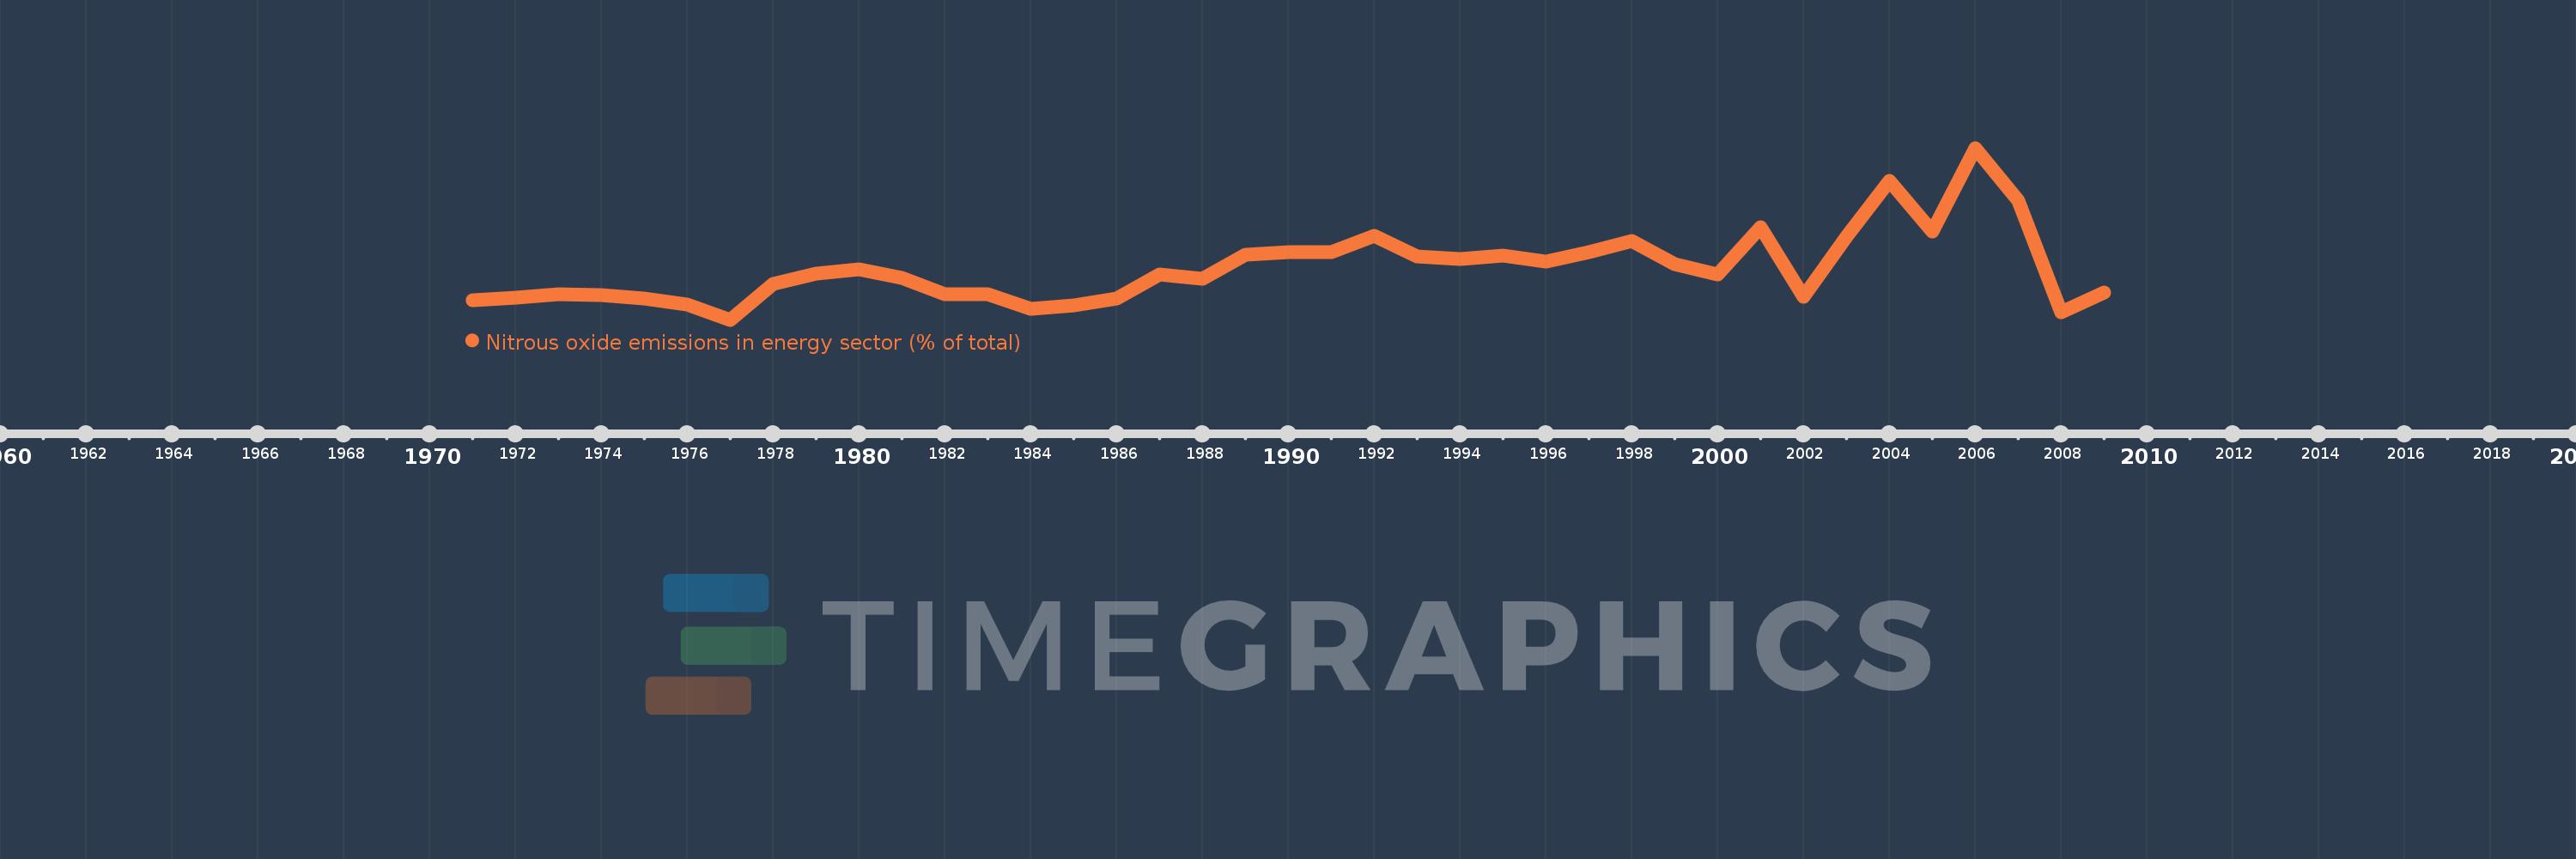
Nitrous oxide emissions in energy sector (% of total)
2009,2008,2007,2006,2005,2004,2003,2002,2001,2000,1999,1998,1997,1996,1995,1994,1993,1992,1991,1990,1989,1988,1987,1986,1985,1984,1983,1982,1981,1980,1979,1978,1977,1976,1975,1974,1973,1972,1971
This statistics in other country:
AfghanistanAlbaniaAlgeriaAmerican SamoaAndorraAngolaAntigua and BarbudaArab WorldArgentinaArmeniaArubaAustraliaAustriaAzerbaijanBahamas, TheBahrainBangladeshBarbadosBelarusBelgiumBelizeBeninBermudaBhutanBoliviaBosnia and HerzegovinaBotswanaBrazilBritish Virgin IslandsBrunei DarussalamBulgariaBurkina FasoBurundiCabo VerdeCambodiaCameroonCanadaCaribbean small statesCayman IslandsCentral African RepublicCentral Europe and the BalticsChadChileChinaColombiaComorosCongo, Dem. Rep.Congo, Rep.Costa RicaCote d'IvoireCroatiaCubaCyprusCzech RepublicDenmarkDjiboutiDominicaDominican RepublicEarly-demographic dividendEast Asia & PacificEast Asia & Pacific (excluding high income)East Asia & Pacific (IDA & IBRD countries)EcuadorEgypt, Arab Rep.El SalvadorEquatorial GuineaEritreaEstoniaEthiopiaEuro areaEurope & Central AsiaEurope & Central Asia (excluding high income)Europe & Central Asia (IDA & IBRD countries)European UnionFaroe IslandsFijiFinlandFragile and conflict affected situationsFranceFrench PolynesiaGabonGambia, TheGeorgiaGermanyGhanaGibraltarGreeceGreenlandGrenadaGuamGuatemalaGuineaGuinea-BissauGuyanaHaitiHeavily indebted poor countries (HIPC)High incomeHondurasHong Kong SAR, ChinaHungaryIBRD onlyIcelandIDA & IBRD totalIDA blendIDA onlyIDA totalIndiaIndonesiaIran, Islamic Rep.IraqIrelandIsraelItalyJamaicaJapanJordanKazakhstanKenyaKiribatiKorea, Dem. People’s Rep.Korea, Rep.KuwaitKyrgyz RepublicLao PDRLate-demographic dividendLatin America & Caribbean Latin America & Caribbean (excluding high income)Latin America & the Caribbean (IDA & IBRD countries)LatviaLeast developed countries: UN classificationLebanonLesothoLiberiaLibyaLithuaniaLow & middle incomeLow incomeLower middle incomeLuxembourgMacao SAR, ChinaMacedonia, FYRMadagascarMalawiMalaysiaMaldivesMaliMaltaMarshall IslandsMauritaniaMauritiusMexicoMicronesia, Fed. Sts.Middle East & North AfricaMiddle East & North Africa (excluding high income)Middle East & North Africa (IDA & IBRD countries)Middle incomeMoldovaMongoliaMoroccoMozambiqueMyanmarNamibiaNauruNepalNetherlandsNew CaledoniaNew ZealandNicaraguaNigerNigeriaNorth AmericaNorthern Mariana IslandsNorwayOECD membersOmanOther small statesPacific island small statesPakistanPalauPanamaPapua New GuineaParaguayPeruPhilippinesPolandPortugalPost-demographic dividendPre-demographic dividendPuerto RicoQatarRomaniaRussian FederationRwandaSamoaSao Tome and PrincipeSaudi ArabiaSenegalSerbiaSeychellesSierra LeoneSingaporeSlovak RepublicSloveniaSmall statesSolomon IslandsSomaliaSouth AfricaSouth AsiaSouth Asia (IDA & IBRD)SpainSri LankaSt. Kitts and NevisSt. LuciaSt. Vincent and the GrenadinesSub-Saharan Africa Sub-Saharan Africa (excluding high income)Sub-Saharan Africa (IDA & IBRD countries)SudanSurinameSwazilandSwedenSwitzerlandSyrian Arab RepublicTajikistanTanzaniaThailandTimor-LesteTogoTongaTrinidad and TobagoTunisiaTurkeyTurkmenistanTurks and Caicos IslandsTuvaluUgandaUkraineUnited Arab EmiratesUnited KingdomUnited StatesUpper middle incomeUruguayUzbekistanVanuatuVenezuela, RBVietnamVirgin Islands (U.S.)WorldYemen, Rep.ZambiaZimbabwe Timeline:
This timeline shows a graph from 1971 to 2009 of Liberia. No data until 1970. Number of actual observations by date: 39.
Source name:
World Development Indicators
Source organization:
World Bank staff estimates from original source: European Commission, Joint Research Centre (JRC)/Netherlands Environmental Assessment Agency (PBL). Emission Database for Global Atmospheric Research (EDGAR): http://edgar.jrc.ec.europa.eu/.
Categories, topics:
Energy & Mining, Environment
Last updated:
apr 23, 2017
Indicators value changes by year
Minimum:
19.103
jan 1, 1977
Maximum:
40.198
jan 1, 2006
At the date of observation
Value
Absolute change
Change from previous value
jan 1, 1971
21.498
+21.498
0.0%
jan 1, 1972
21.763
+0.265
1.23%
jan 1, 1973
22.241
+0.477
2.19%
jan 1, 1974
22.145
-0.095
-0.43%
jan 1, 1975
21.754
-0.391
-1.77%
jan 1, 1976
20.96
-0.794
-3.65%
jan 1, 1977
19.103
-1.857
-8.86%
jan 1, 1978
23.497
+4.394
23.0%
jan 1, 1979
24.722
+1.225
5.22%
jan 1, 1980
25.32
+0.598
2.42%
jan 1, 1981
24.207
-1.114
-4.4%
jan 1, 1982
22.219
-1.988
-8.21%
jan 1, 1983
22.239
+0.021
0.09%
jan 1, 1984
20.416
-1.823
-8.2%
jan 1, 1985
20.881
+0.465
2.28%
jan 1, 1986
21.76
+0.88
4.21%
jan 1, 1987
24.62
+2.859
13.14%
jan 1, 1988
24.179
-0.44
-1.79%
jan 1, 1989
27.091
+2.912
12.04%
jan 1, 1990
27.366
+0.275
1.01%
jan 1, 1991
27.366
0.0
0.0%
jan 1, 1992
29.424
+2.059
7.52%
jan 1, 1993
26.9
-2.525
-8.58%
jan 1, 1994
26.526
-0.373
-1.39%
jan 1, 1995
27.03
+0.504
1.9%
jan 1, 1996
26.252
-0.778
-2.88%
jan 1, 1997
27.39
+1.138
4.33%
jan 1, 1998
28.826
+1.436
5.24%
jan 1, 1999
25.954
-2.872
-9.96%
jan 1, 2000
24.644
-1.31
-5.05%
jan 1, 2001
30.411
+5.766
23.4%
jan 1, 2002
21.941
-8.47
-27.85%
jan 1, 2003
29.275
+7.335
33.43%
jan 1, 2004
36.162
+6.887
23.52%
jan 1, 2005
29.921
-6.241
-17.26%
jan 1, 2006
40.198
+10.277
34.35%
jan 1, 2007
33.754
-6.444
-16.03%
jan 1, 2008
19.979
-13.775
-40.81%
jan 1, 2009
22.477
+2.498
12.5%
Ranking of countries by current statistics by years


Comments: