29
/
en
AIzaSyAYiBZKx7MnpbEhh9jyipgxe19OcubqV5w
April 1, 2024
276966
United States
USA
true
2
1
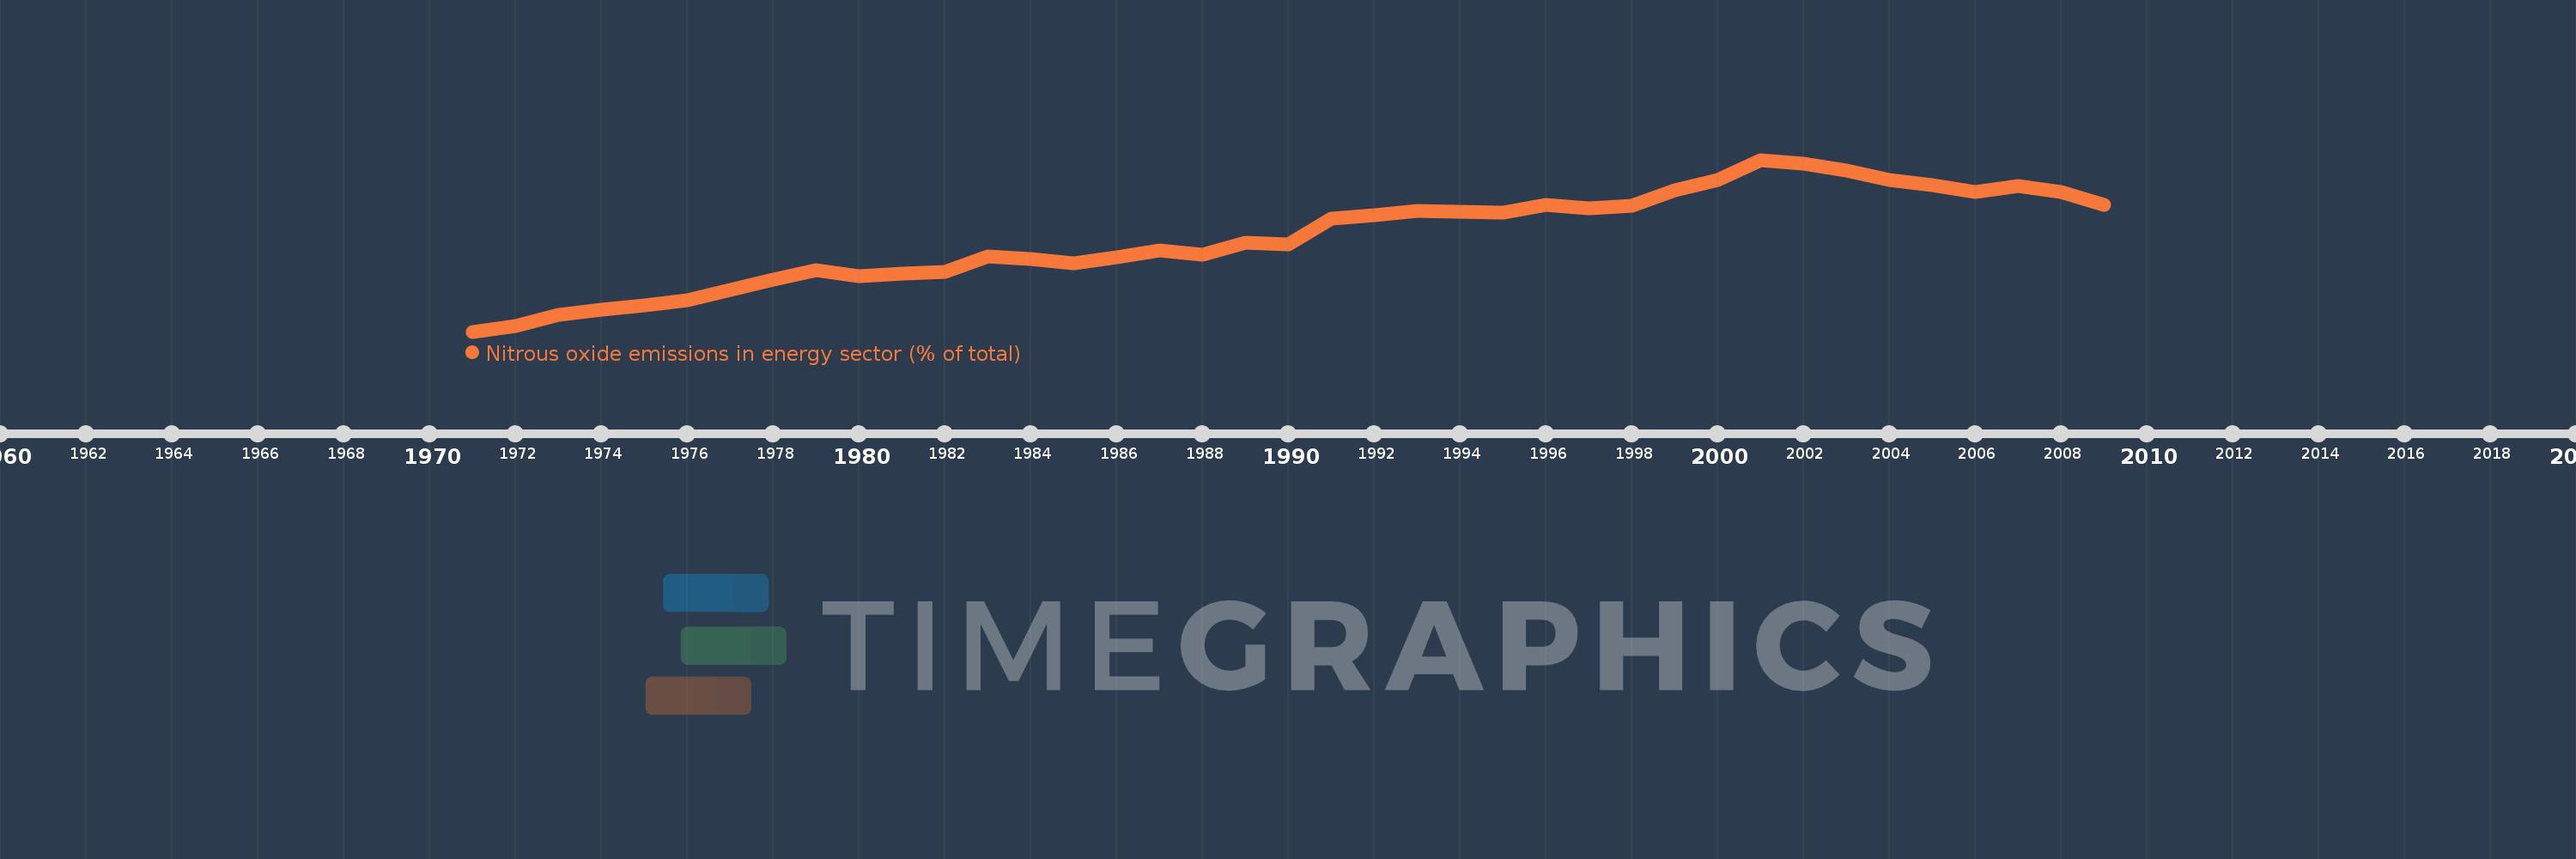
Nitrous oxide emissions in energy sector (% of total)
2009,2008,2007,2006,2005,2004,2003,2002,2001,2000,1999,1998,1997,1996,1995,1994,1993,1992,1991,1990,1989,1988,1987,1986,1985,1984,1983,1982,1981,1980,1979,1978,1977,1976,1975,1974,1973,1972,1971
This statistics in other country:
AfghanistanAlbaniaAlgeriaAmerican SamoaAndorraAngolaAntigua and BarbudaArab WorldArgentinaArmeniaArubaAustraliaAustriaAzerbaijanBahamas, TheBahrainBangladeshBarbadosBelarusBelgiumBelizeBeninBermudaBhutanBoliviaBosnia and HerzegovinaBotswanaBrazilBritish Virgin IslandsBrunei DarussalamBulgariaBurkina FasoBurundiCabo VerdeCambodiaCameroonCanadaCaribbean small statesCayman IslandsCentral African RepublicCentral Europe and the BalticsChadChileChinaColombiaComorosCongo, Dem. Rep.Congo, Rep.Costa RicaCote d'IvoireCroatiaCubaCyprusCzech RepublicDenmarkDjiboutiDominicaDominican RepublicEarly-demographic dividendEast Asia & PacificEast Asia & Pacific (excluding high income)East Asia & Pacific (IDA & IBRD countries)EcuadorEgypt, Arab Rep.El SalvadorEquatorial GuineaEritreaEstoniaEthiopiaEuro areaEurope & Central AsiaEurope & Central Asia (excluding high income)Europe & Central Asia (IDA & IBRD countries)European UnionFaroe IslandsFijiFinlandFragile and conflict affected situationsFranceFrench PolynesiaGabonGambia, TheGeorgiaGermanyGhanaGibraltarGreeceGreenlandGrenadaGuamGuatemalaGuineaGuinea-BissauGuyanaHaitiHeavily indebted poor countries (HIPC)High incomeHondurasHong Kong SAR, ChinaHungaryIBRD onlyIcelandIDA & IBRD totalIDA blendIDA onlyIDA totalIndiaIndonesiaIran, Islamic Rep.IraqIrelandIsraelItalyJamaicaJapanJordanKazakhstanKenyaKiribatiKorea, Dem. People’s Rep.Korea, Rep.KuwaitKyrgyz RepublicLao PDRLate-demographic dividendLatin America & Caribbean Latin America & Caribbean (excluding high income)Latin America & the Caribbean (IDA & IBRD countries)LatviaLeast developed countries: UN classificationLebanonLesothoLiberiaLibyaLithuaniaLow & middle incomeLow incomeLower middle incomeLuxembourgMacao SAR, ChinaMacedonia, FYRMadagascarMalawiMalaysiaMaldivesMaliMaltaMarshall IslandsMauritaniaMauritiusMexicoMicronesia, Fed. Sts.Middle East & North AfricaMiddle East & North Africa (excluding high income)Middle East & North Africa (IDA & IBRD countries)Middle incomeMoldovaMongoliaMoroccoMozambiqueMyanmarNamibiaNauruNepalNetherlandsNew CaledoniaNew ZealandNicaraguaNigerNigeriaNorth AmericaNorthern Mariana IslandsNorwayOECD membersOmanOther small statesPacific island small statesPakistanPalauPanamaPapua New GuineaParaguayPeruPhilippinesPolandPortugalPost-demographic dividendPre-demographic dividendPuerto RicoQatarRomaniaRussian FederationRwandaSamoaSao Tome and PrincipeSaudi ArabiaSenegalSerbiaSeychellesSierra LeoneSingaporeSlovak RepublicSloveniaSmall statesSolomon IslandsSomaliaSouth AfricaSouth AsiaSouth Asia (IDA & IBRD)SpainSri LankaSt. Kitts and NevisSt. LuciaSt. Vincent and the GrenadinesSub-Saharan Africa Sub-Saharan Africa (excluding high income)Sub-Saharan Africa (IDA & IBRD countries)SudanSurinameSwazilandSwedenSwitzerlandSyrian Arab RepublicTajikistanTanzaniaThailandTimor-LesteTogoTongaTrinidad and TobagoTunisiaTurkeyTurkmenistanTurks and Caicos IslandsTuvaluUgandaUkraineUnited Arab EmiratesUnited KingdomUnited StatesUpper middle incomeUruguayUzbekistanVanuatuVenezuela, RBVietnamVirgin Islands (U.S.)WorldYemen, Rep.ZambiaZimbabwe Timeline:
This timeline shows a graph from 1971 to 2009 of United States. No data until 1970. Number of actual observations by date: 39.
Source name:
World Development Indicators
Source organization:
World Bank staff estimates from original source: European Commission, Joint Research Centre (JRC)/Netherlands Environmental Assessment Agency (PBL). Emission Database for Global Atmospheric Research (EDGAR): http://edgar.jrc.ec.europa.eu/.
Categories, topics:
Energy & Mining, Environment
Last updated:
apr 23, 2017
Indicators value changes by year
Minimum:
11.563
jan 1, 1971
Maximum:
25.398
jan 1, 2001
At the date of observation
Value
Absolute change
Change from previous value
jan 1, 1971
11.563
+11.563
0.0%
jan 1, 1972
11.987
+0.424
3.67%
jan 1, 1973
12.914
+0.927
7.73%
jan 1, 1974
13.297
+0.384
2.97%
jan 1, 1975
13.699
+0.402
3.02%
jan 1, 1976
14.114
+0.414
3.02%
jan 1, 1977
14.925
+0.811
5.75%
jan 1, 1978
15.77
+0.846
5.67%
jan 1, 1979
16.486
+0.716
4.54%
jan 1, 1980
16.055
-0.432
-2.62%
jan 1, 1981
16.238
+0.183
1.14%
jan 1, 1982
16.356
+0.118
0.73%
jan 1, 1983
17.592
+1.235
7.55%
jan 1, 1984
17.408
-0.184
-1.05%
jan 1, 1985
17.091
-0.316
-1.82%
jan 1, 1986
17.548
+0.457
2.67%
jan 1, 1987
18.081
+0.533
3.04%
jan 1, 1988
17.777
-0.305
-1.69%
jan 1, 1989
18.742
+0.965
5.43%
jan 1, 1990
18.574
-0.168
-0.89%
jan 1, 1991
20.692
+2.118
11.4%
jan 1, 1992
20.944
+0.252
1.22%
jan 1, 1993
21.307
+0.363
1.73%
jan 1, 1994
21.222
-0.084
-0.4%
jan 1, 1995
21.15
-0.072
-0.34%
jan 1, 1996
21.748
+0.598
2.83%
jan 1, 1997
21.493
-0.255
-1.17%
jan 1, 1998
21.673
+0.18
0.84%
jan 1, 1999
22.949
+1.277
5.89%
jan 1, 2000
23.758
+0.808
3.52%
jan 1, 2001
25.398
+1.64
6.9%
jan 1, 2002
25.08
-0.318
-1.25%
jan 1, 2003
24.563
-0.517
-2.06%
jan 1, 2004
23.74
-0.822
-3.35%
jan 1, 2005
23.335
-0.405
-1.71%
jan 1, 2006
22.797
-0.538
-2.31%
jan 1, 2007
23.303
+0.506
2.22%
jan 1, 2008
22.815
-0.488
-2.1%
jan 1, 2009
21.732
-1.083
-4.75%
Ranking of countries by current statistics by years


Comments: