29
/
en
AIzaSyAYiBZKx7MnpbEhh9jyipgxe19OcubqV5w
April 1, 2024
111349
Congo, Rep.
COG
true
2
1
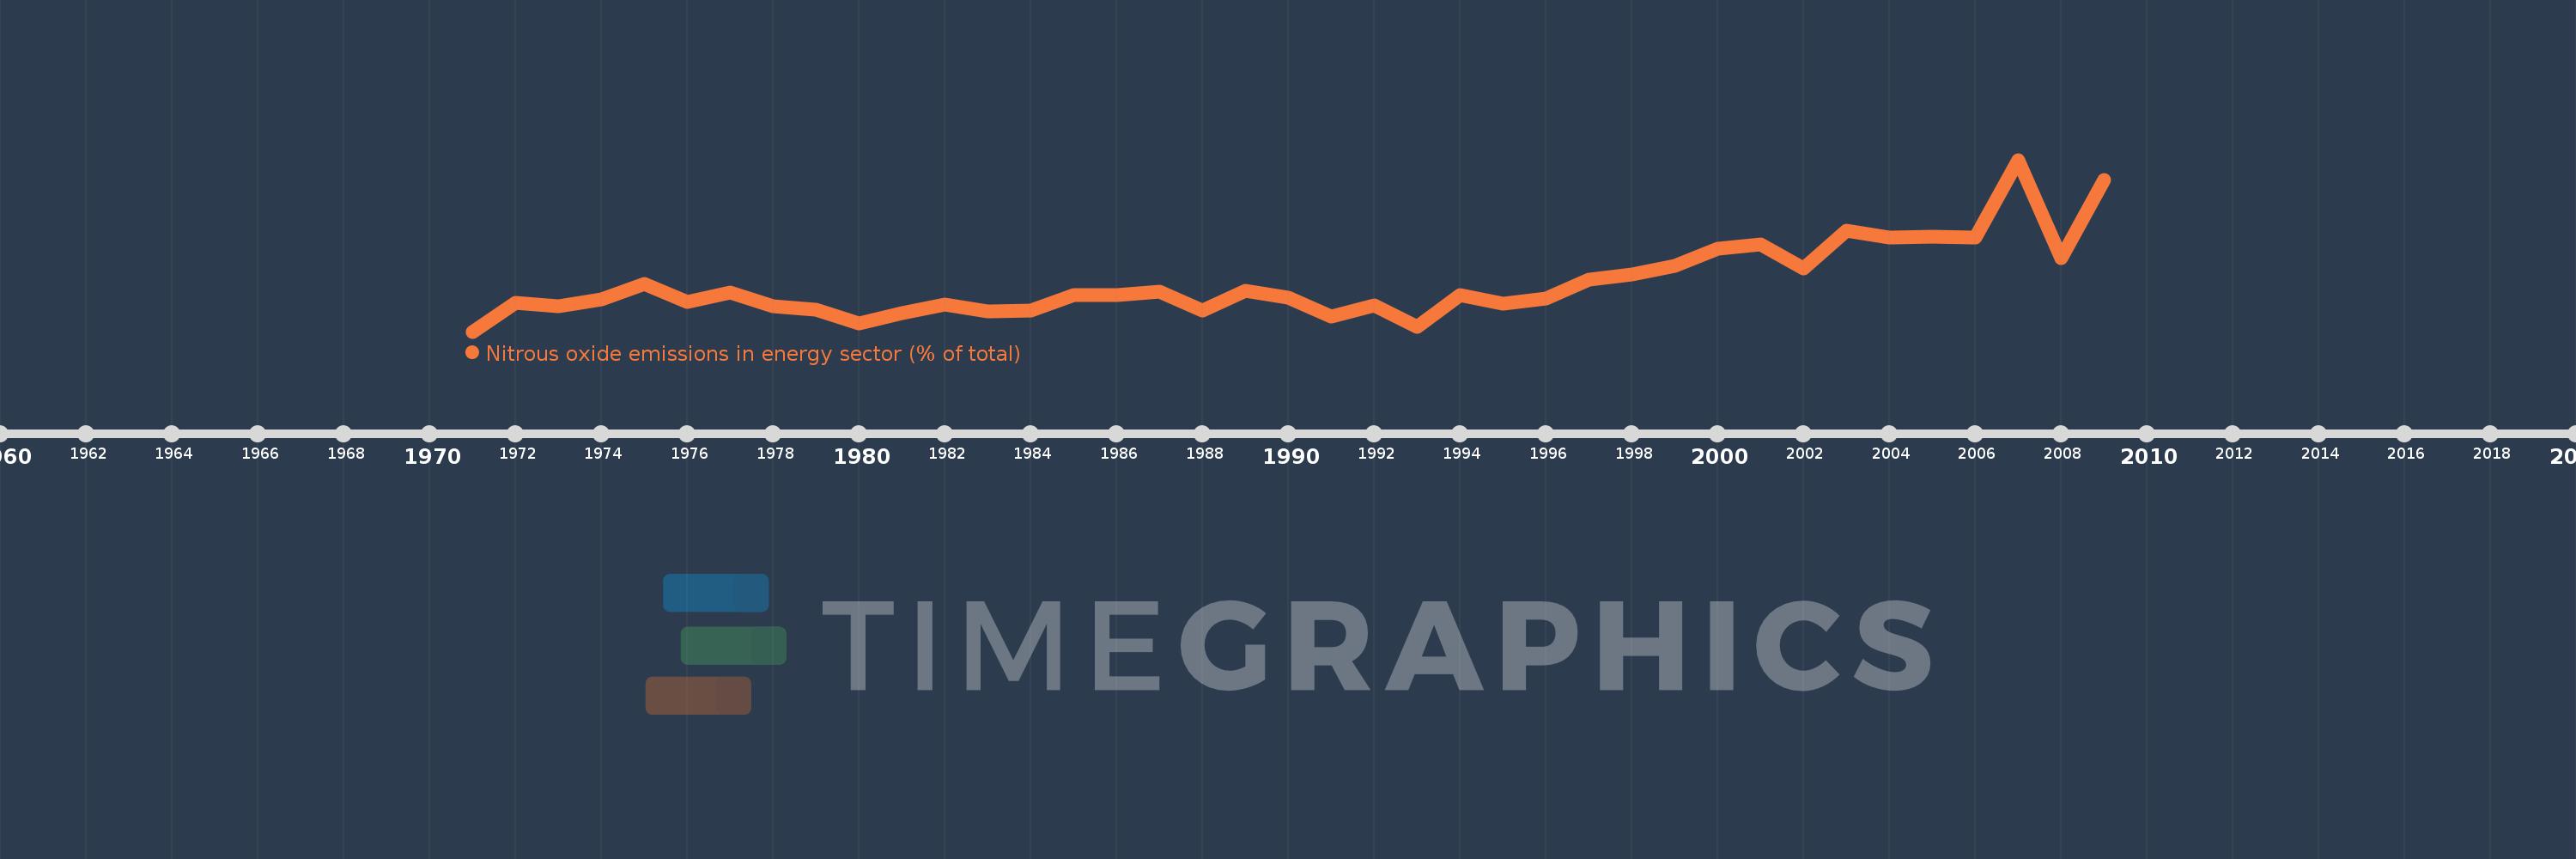
Nitrous oxide emissions in energy sector (% of total)
2009,2008,2007,2006,2005,2004,2003,2002,2001,2000,1999,1998,1997,1996,1995,1994,1993,1992,1991,1990,1989,1988,1987,1986,1985,1984,1983,1982,1981,1980,1979,1978,1977,1976,1975,1974,1973,1972,1971
This statistics in other country:
AfghanistanAlbaniaAlgeriaAmerican SamoaAndorraAngolaAntigua and BarbudaArab WorldArgentinaArmeniaArubaAustraliaAustriaAzerbaijanBahamas, TheBahrainBangladeshBarbadosBelarusBelgiumBelizeBeninBermudaBhutanBoliviaBosnia and HerzegovinaBotswanaBrazilBritish Virgin IslandsBrunei DarussalamBulgariaBurkina FasoBurundiCabo VerdeCambodiaCameroonCanadaCaribbean small statesCayman IslandsCentral African RepublicCentral Europe and the BalticsChadChileChinaColombiaComorosCongo, Dem. Rep.Congo, Rep.Costa RicaCote d'IvoireCroatiaCubaCyprusCzech RepublicDenmarkDjiboutiDominicaDominican RepublicEarly-demographic dividendEast Asia & PacificEast Asia & Pacific (excluding high income)East Asia & Pacific (IDA & IBRD countries)EcuadorEgypt, Arab Rep.El SalvadorEquatorial GuineaEritreaEstoniaEthiopiaEuro areaEurope & Central AsiaEurope & Central Asia (excluding high income)Europe & Central Asia (IDA & IBRD countries)European UnionFaroe IslandsFijiFinlandFragile and conflict affected situationsFranceFrench PolynesiaGabonGambia, TheGeorgiaGermanyGhanaGibraltarGreeceGreenlandGrenadaGuamGuatemalaGuineaGuinea-BissauGuyanaHaitiHeavily indebted poor countries (HIPC)High incomeHondurasHong Kong SAR, ChinaHungaryIBRD onlyIcelandIDA & IBRD totalIDA blendIDA onlyIDA totalIndiaIndonesiaIran, Islamic Rep.IraqIrelandIsraelItalyJamaicaJapanJordanKazakhstanKenyaKiribatiKorea, Dem. People’s Rep.Korea, Rep.KuwaitKyrgyz RepublicLao PDRLate-demographic dividendLatin America & Caribbean Latin America & Caribbean (excluding high income)Latin America & the Caribbean (IDA & IBRD countries)LatviaLeast developed countries: UN classificationLebanonLesothoLiberiaLibyaLithuaniaLow & middle incomeLow incomeLower middle incomeLuxembourgMacao SAR, ChinaMacedonia, FYRMadagascarMalawiMalaysiaMaldivesMaliMaltaMarshall IslandsMauritaniaMauritiusMexicoMicronesia, Fed. Sts.Middle East & North AfricaMiddle East & North Africa (excluding high income)Middle East & North Africa (IDA & IBRD countries)Middle incomeMoldovaMongoliaMoroccoMozambiqueMyanmarNamibiaNauruNepalNetherlandsNew CaledoniaNew ZealandNicaraguaNigerNigeriaNorth AmericaNorthern Mariana IslandsNorwayOECD membersOmanOther small statesPacific island small statesPakistanPalauPanamaPapua New GuineaParaguayPeruPhilippinesPolandPortugalPost-demographic dividendPre-demographic dividendPuerto RicoQatarRomaniaRussian FederationRwandaSamoaSao Tome and PrincipeSaudi ArabiaSenegalSerbiaSeychellesSierra LeoneSingaporeSlovak RepublicSloveniaSmall statesSolomon IslandsSomaliaSouth AfricaSouth AsiaSouth Asia (IDA & IBRD)SpainSri LankaSt. Kitts and NevisSt. LuciaSt. Vincent and the GrenadinesSub-Saharan Africa Sub-Saharan Africa (excluding high income)Sub-Saharan Africa (IDA & IBRD countries)SudanSurinameSwazilandSwedenSwitzerlandSyrian Arab RepublicTajikistanTanzaniaThailandTimor-LesteTogoTongaTrinidad and TobagoTunisiaTurkeyTurkmenistanTurks and Caicos IslandsTuvaluUgandaUkraineUnited Arab EmiratesUnited KingdomUnited StatesUpper middle incomeUruguayUzbekistanVanuatuVenezuela, RBVietnamVirgin Islands (U.S.)WorldYemen, Rep.ZambiaZimbabwe Timeline:
This timeline shows a graph from 1971 to 2009 of Congo, Rep.. No data until 1970. Number of actual observations by date: 39.
Source name:
World Development Indicators
Source organization:
World Bank staff estimates from original source: European Commission, Joint Research Centre (JRC)/Netherlands Environmental Assessment Agency (PBL). Emission Database for Global Atmospheric Research (EDGAR): http://edgar.jrc.ec.europa.eu/.
Categories, topics:
Energy & Mining, Environment
Last updated:
apr 23, 2017
Indicators value changes by year
At the date of observation
Value
Absolute change
Change from previous value
jan 1, 1971
0.648
+0.648
0.0%
jan 1, 1972
1.036
+0.388
59.88%
jan 1, 1973
0.987
-0.049
-4.74%
jan 1, 1974
1.075
+0.088
8.9%
jan 1, 1975
1.28
+0.205
19.06%
jan 1, 1976
1.048
-0.232
-18.12%
jan 1, 1977
1.171
+0.123
11.76%
jan 1, 1978
0.989
-0.182
-15.56%
jan 1, 1979
0.946
-0.043
-4.3%
jan 1, 1980
0.761
-0.185
-19.58%
jan 1, 1981
0.898
+0.137
18.02%
jan 1, 1982
1.006
+0.108
11.98%
jan 1, 1983
0.922
-0.084
-8.33%
jan 1, 1984
0.93
+0.008
0.84%
jan 1, 1985
1.134
+0.205
22.02%
jan 1, 1986
1.133
-0.002
-0.14%
jan 1, 1987
1.186
+0.053
4.67%
jan 1, 1988
0.925
-0.261
-21.99%
jan 1, 1989
1.195
+0.27
29.19%
jan 1, 1990
1.102
-0.093
-7.79%
jan 1, 1991
0.85
-0.252
-22.84%
jan 1, 1992
0.998
+0.147
17.33%
jan 1, 1993
0.714
-0.283
-28.4%
jan 1, 1994
1.136
+0.421
59.01%
jan 1, 1995
1.026
-0.11
-9.67%
jan 1, 1996
1.088
+0.062
6.04%
jan 1, 1997
1.341
+0.253
23.25%
jan 1, 1998
1.409
+0.068
5.05%
jan 1, 1999
1.523
+0.115
8.15%
jan 1, 2000
1.758
+0.234
15.38%
jan 1, 2001
1.819
+0.061
3.48%
jan 1, 2002
1.488
-0.331
-18.2%
jan 1, 2003
1.993
+0.505
33.98%
jan 1, 2004
1.903
-0.091
-4.55%
jan 1, 2005
1.922
+0.02
1.03%
jan 1, 2006
1.907
-0.015
-0.78%
jan 1, 2007
2.945
+1.038
54.42%
jan 1, 2008
1.631
-1.314
-44.62%
jan 1, 2009
2.677
+1.046
64.13%
Ranking of countries by current statistics by years


Comments: