29
/
en
AIzaSyAYiBZKx7MnpbEhh9jyipgxe19OcubqV5w
April 1, 2024
256663
Sweden
SWE
true
2
1
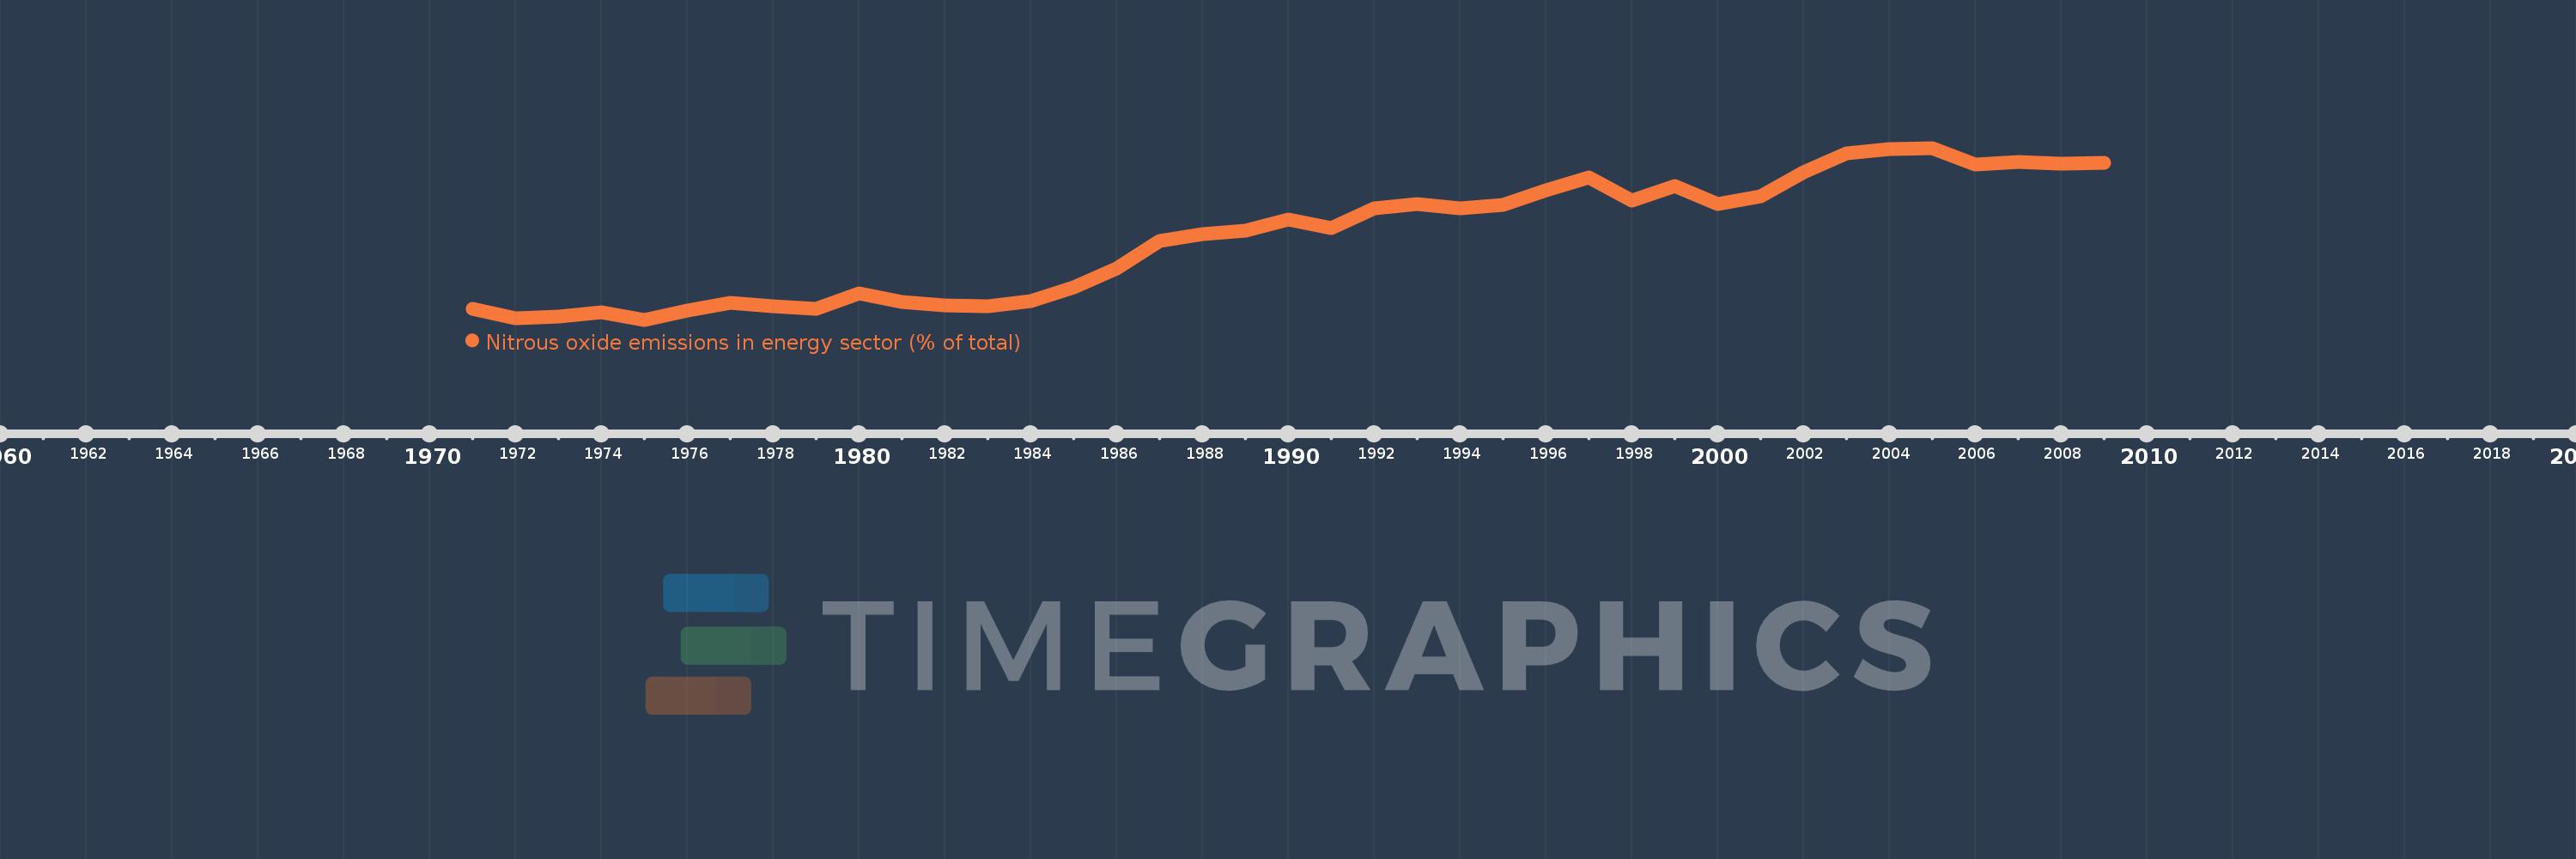
Nitrous oxide emissions in energy sector (% of total)
2009,2008,2007,2006,2005,2004,2003,2002,2001,2000,1999,1998,1997,1996,1995,1994,1993,1992,1991,1990,1989,1988,1987,1986,1985,1984,1983,1982,1981,1980,1979,1978,1977,1976,1975,1974,1973,1972,1971
This statistics in other country:
AfghanistanAlbaniaAlgeriaAmerican SamoaAndorraAngolaAntigua and BarbudaArab WorldArgentinaArmeniaArubaAustraliaAustriaAzerbaijanBahamas, TheBahrainBangladeshBarbadosBelarusBelgiumBelizeBeninBermudaBhutanBoliviaBosnia and HerzegovinaBotswanaBrazilBritish Virgin IslandsBrunei DarussalamBulgariaBurkina FasoBurundiCabo VerdeCambodiaCameroonCanadaCaribbean small statesCayman IslandsCentral African RepublicCentral Europe and the BalticsChadChileChinaColombiaComorosCongo, Dem. Rep.Congo, Rep.Costa RicaCote d'IvoireCroatiaCubaCyprusCzech RepublicDenmarkDjiboutiDominicaDominican RepublicEarly-demographic dividendEast Asia & PacificEast Asia & Pacific (excluding high income)East Asia & Pacific (IDA & IBRD countries)EcuadorEgypt, Arab Rep.El SalvadorEquatorial GuineaEritreaEstoniaEthiopiaEuro areaEurope & Central AsiaEurope & Central Asia (excluding high income)Europe & Central Asia (IDA & IBRD countries)European UnionFaroe IslandsFijiFinlandFragile and conflict affected situationsFranceFrench PolynesiaGabonGambia, TheGeorgiaGermanyGhanaGibraltarGreeceGreenlandGrenadaGuamGuatemalaGuineaGuinea-BissauGuyanaHaitiHeavily indebted poor countries (HIPC)High incomeHondurasHong Kong SAR, ChinaHungaryIBRD onlyIcelandIDA & IBRD totalIDA blendIDA onlyIDA totalIndiaIndonesiaIran, Islamic Rep.IraqIrelandIsraelItalyJamaicaJapanJordanKazakhstanKenyaKiribatiKorea, Dem. People’s Rep.Korea, Rep.KuwaitKyrgyz RepublicLao PDRLate-demographic dividendLatin America & Caribbean Latin America & Caribbean (excluding high income)Latin America & the Caribbean (IDA & IBRD countries)LatviaLeast developed countries: UN classificationLebanonLesothoLiberiaLibyaLithuaniaLow & middle incomeLow incomeLower middle incomeLuxembourgMacao SAR, ChinaMacedonia, FYRMadagascarMalawiMalaysiaMaldivesMaliMaltaMarshall IslandsMauritaniaMauritiusMexicoMicronesia, Fed. Sts.Middle East & North AfricaMiddle East & North Africa (excluding high income)Middle East & North Africa (IDA & IBRD countries)Middle incomeMoldovaMongoliaMoroccoMozambiqueMyanmarNamibiaNauruNepalNetherlandsNew CaledoniaNew ZealandNicaraguaNigerNigeriaNorth AmericaNorthern Mariana IslandsNorwayOECD membersOmanOther small statesPacific island small statesPakistanPalauPanamaPapua New GuineaParaguayPeruPhilippinesPolandPortugalPost-demographic dividendPre-demographic dividendPuerto RicoQatarRomaniaRussian FederationRwandaSamoaSao Tome and PrincipeSaudi ArabiaSenegalSerbiaSeychellesSierra LeoneSingaporeSlovak RepublicSloveniaSmall statesSolomon IslandsSomaliaSouth AfricaSouth AsiaSouth Asia (IDA & IBRD)SpainSri LankaSt. Kitts and NevisSt. LuciaSt. Vincent and the GrenadinesSub-Saharan Africa Sub-Saharan Africa (excluding high income)Sub-Saharan Africa (IDA & IBRD countries)SudanSurinameSwazilandSwedenSwitzerlandSyrian Arab RepublicTajikistanTanzaniaThailandTimor-LesteTogoTongaTrinidad and TobagoTunisiaTurkeyTurkmenistanTurks and Caicos IslandsTuvaluUgandaUkraineUnited Arab EmiratesUnited KingdomUnited StatesUpper middle incomeUruguayUzbekistanVanuatuVenezuela, RBVietnamVirgin Islands (U.S.)WorldYemen, Rep.ZambiaZimbabwe Timeline:
This timeline shows a graph from 1971 to 2009 of Sweden. No data until 1970. Number of actual observations by date: 39.
Source name:
World Development Indicators
Source organization:
World Bank staff estimates from original source: European Commission, Joint Research Centre (JRC)/Netherlands Environmental Assessment Agency (PBL). Emission Database for Global Atmospheric Research (EDGAR): http://edgar.jrc.ec.europa.eu/.
Categories, topics:
Energy & Mining, Environment
Last updated:
apr 23, 2017
Indicators value changes by year
Maximum:
20.005
jan 1, 2005
At the date of observation
Value
Absolute change
Change from previous value
jan 1, 1971
8.877
+8.877
0.0%
jan 1, 1972
8.185
-0.692
-7.8%
jan 1, 1973
8.329
+0.144
1.77%
jan 1, 1974
8.623
+0.294
3.53%
jan 1, 1975
8.102
-0.521
-6.05%
jan 1, 1976
8.717
+0.615
7.6%
jan 1, 1977
9.296
+0.579
6.64%
jan 1, 1978
9.015
-0.281
-3.02%
jan 1, 1979
8.829
-0.186
-2.07%
jan 1, 1980
9.917
+1.089
12.33%
jan 1, 1981
9.316
-0.602
-6.07%
jan 1, 1982
9.113
-0.203
-2.18%
jan 1, 1983
9.057
-0.056
-0.61%
jan 1, 1984
9.397
+0.34
3.76%
jan 1, 1985
10.332
+0.935
9.95%
jan 1, 1986
11.676
+1.344
13.0%
jan 1, 1987
13.531
+1.855
15.88%
jan 1, 1988
14.054
+0.524
3.87%
jan 1, 1989
14.285
+0.23
1.64%
jan 1, 1990
15.047
+0.762
5.34%
jan 1, 1991
14.462
-0.585
-3.89%
jan 1, 1992
15.829
+1.367
9.45%
jan 1, 1993
16.113
+0.283
1.79%
jan 1, 1994
15.81
-0.303
-1.88%
jan 1, 1995
16.08
+0.27
1.71%
jan 1, 1996
17.088
+1.008
6.27%
jan 1, 1997
17.948
+0.86
5.03%
jan 1, 1998
16.34
-1.608
-8.96%
jan 1, 1999
17.352
+1.012
6.19%
jan 1, 2000
16.138
-1.213
-6.99%
jan 1, 2001
16.644
+0.505
3.13%
jan 1, 2002
18.337
+1.693
10.17%
jan 1, 2003
19.604
+1.266
6.91%
jan 1, 2004
19.943
+0.34
1.73%
jan 1, 2005
20.005
+0.062
0.31%
jan 1, 2006
18.866
-1.139
-5.69%
jan 1, 2007
19.044
+0.178
0.94%
jan 1, 2008
18.918
-0.126
-0.66%
jan 1, 2009
18.951
+0.033
0.17%
Ranking of countries by current statistics by years


Comments: