29
/
en
AIzaSyAYiBZKx7MnpbEhh9jyipgxe19OcubqV5w
April 1, 2024
96529
Burundi
BDI
true
2
1
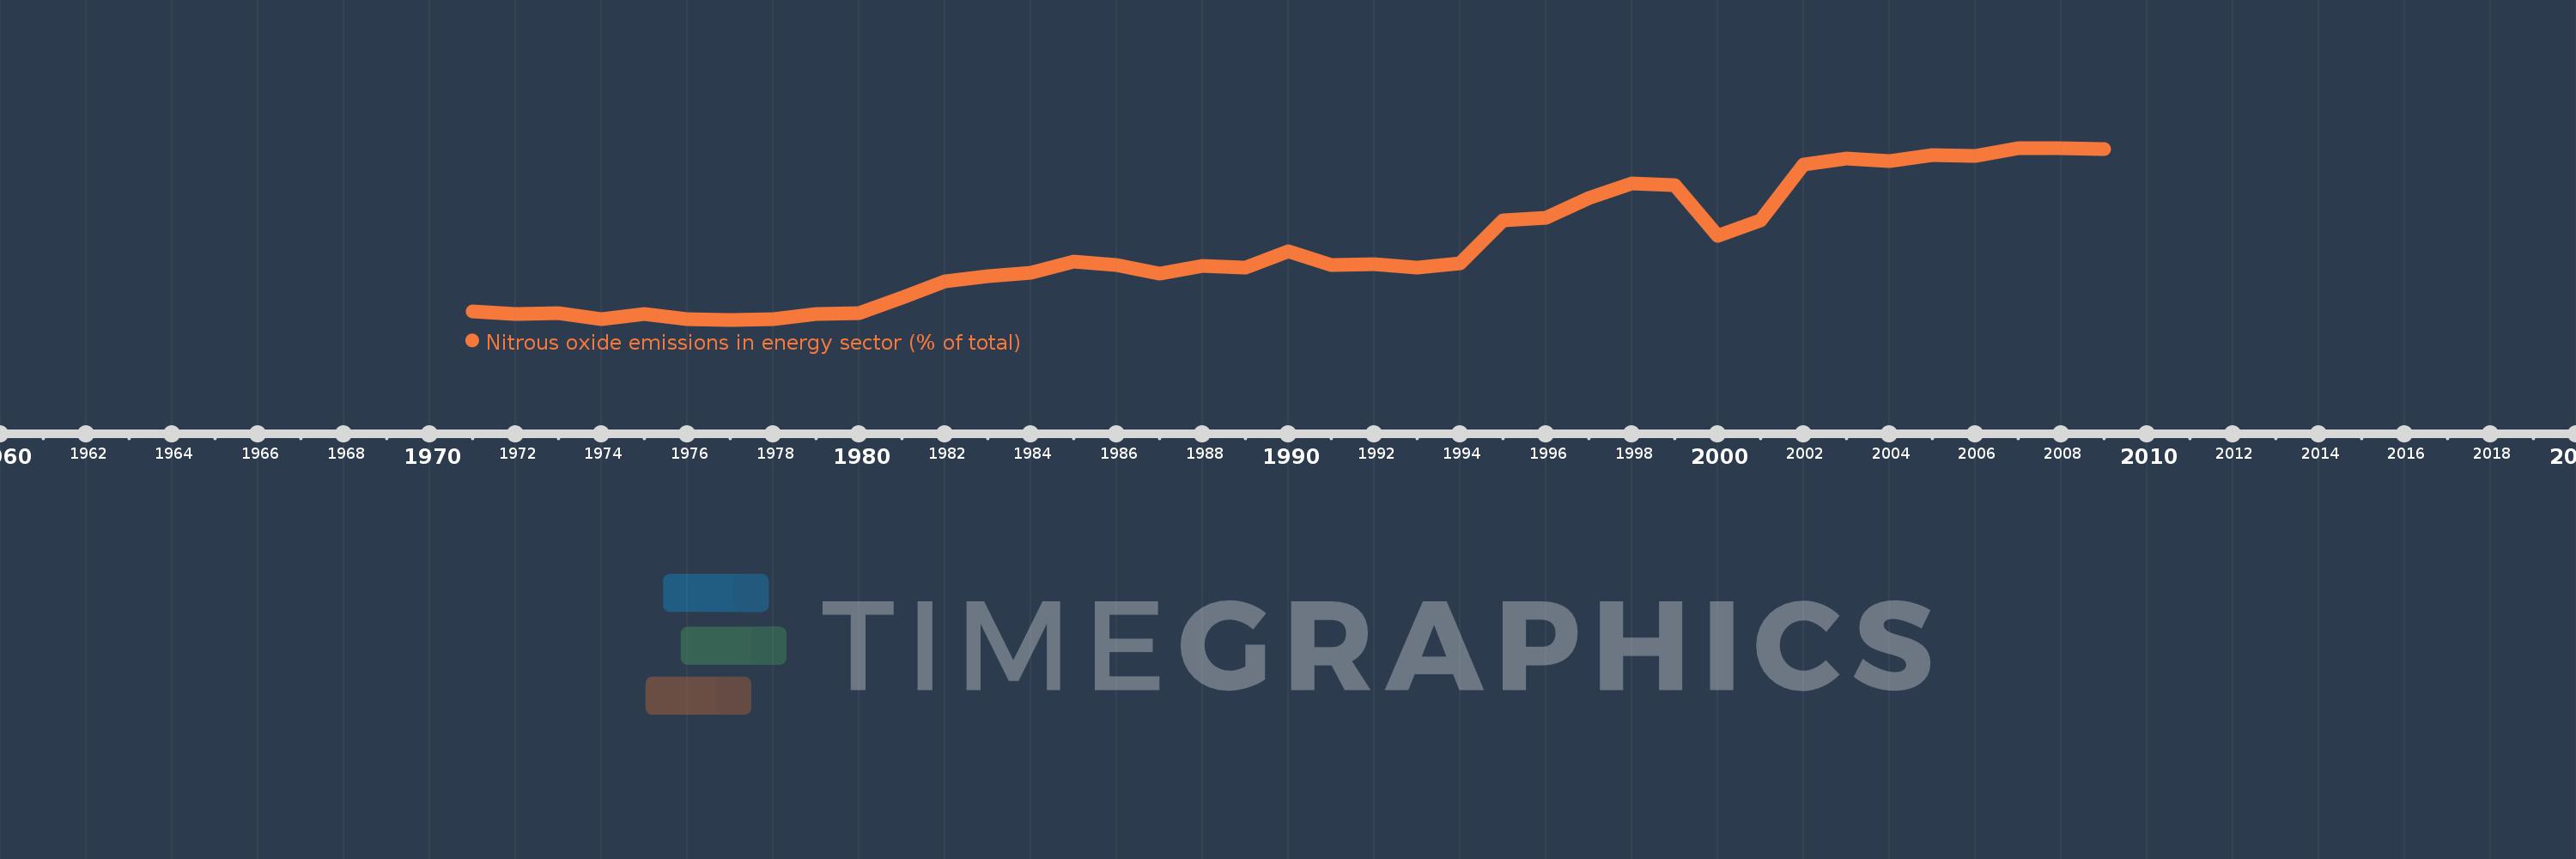
Nitrous oxide emissions in energy sector (% of total)
2009,2008,2007,2006,2005,2004,2003,2002,2001,2000,1999,1998,1997,1996,1995,1994,1993,1992,1991,1990,1989,1988,1987,1986,1985,1984,1983,1982,1981,1980,1979,1978,1977,1976,1975,1974,1973,1972,1971
This statistics in other country:
AfghanistanAlbaniaAlgeriaAmerican SamoaAndorraAngolaAntigua and BarbudaArab WorldArgentinaArmeniaArubaAustraliaAustriaAzerbaijanBahamas, TheBahrainBangladeshBarbadosBelarusBelgiumBelizeBeninBermudaBhutanBoliviaBosnia and HerzegovinaBotswanaBrazilBritish Virgin IslandsBrunei DarussalamBulgariaBurkina FasoBurundiCabo VerdeCambodiaCameroonCanadaCaribbean small statesCayman IslandsCentral African RepublicCentral Europe and the BalticsChadChileChinaColombiaComorosCongo, Dem. Rep.Congo, Rep.Costa RicaCote d'IvoireCroatiaCubaCyprusCzech RepublicDenmarkDjiboutiDominicaDominican RepublicEarly-demographic dividendEast Asia & PacificEast Asia & Pacific (excluding high income)East Asia & Pacific (IDA & IBRD countries)EcuadorEgypt, Arab Rep.El SalvadorEquatorial GuineaEritreaEstoniaEthiopiaEuro areaEurope & Central AsiaEurope & Central Asia (excluding high income)Europe & Central Asia (IDA & IBRD countries)European UnionFaroe IslandsFijiFinlandFragile and conflict affected situationsFranceFrench PolynesiaGabonGambia, TheGeorgiaGermanyGhanaGibraltarGreeceGreenlandGrenadaGuamGuatemalaGuineaGuinea-BissauGuyanaHaitiHeavily indebted poor countries (HIPC)High incomeHondurasHong Kong SAR, ChinaHungaryIBRD onlyIcelandIDA & IBRD totalIDA blendIDA onlyIDA totalIndiaIndonesiaIran, Islamic Rep.IraqIrelandIsraelItalyJamaicaJapanJordanKazakhstanKenyaKiribatiKorea, Dem. People’s Rep.Korea, Rep.KuwaitKyrgyz RepublicLao PDRLate-demographic dividendLatin America & Caribbean Latin America & Caribbean (excluding high income)Latin America & the Caribbean (IDA & IBRD countries)LatviaLeast developed countries: UN classificationLebanonLesothoLiberiaLibyaLithuaniaLow & middle incomeLow incomeLower middle incomeLuxembourgMacao SAR, ChinaMacedonia, FYRMadagascarMalawiMalaysiaMaldivesMaliMaltaMarshall IslandsMauritaniaMauritiusMexicoMicronesia, Fed. Sts.Middle East & North AfricaMiddle East & North Africa (excluding high income)Middle East & North Africa (IDA & IBRD countries)Middle incomeMoldovaMongoliaMoroccoMozambiqueMyanmarNamibiaNauruNepalNetherlandsNew CaledoniaNew ZealandNicaraguaNigerNigeriaNorth AmericaNorthern Mariana IslandsNorwayOECD membersOmanOther small statesPacific island small statesPakistanPalauPanamaPapua New GuineaParaguayPeruPhilippinesPolandPortugalPost-demographic dividendPre-demographic dividendPuerto RicoQatarRomaniaRussian FederationRwandaSamoaSao Tome and PrincipeSaudi ArabiaSenegalSerbiaSeychellesSierra LeoneSingaporeSlovak RepublicSloveniaSmall statesSolomon IslandsSomaliaSouth AfricaSouth AsiaSouth Asia (IDA & IBRD)SpainSri LankaSt. Kitts and NevisSt. LuciaSt. Vincent and the GrenadinesSub-Saharan Africa Sub-Saharan Africa (excluding high income)Sub-Saharan Africa (IDA & IBRD countries)SudanSurinameSwazilandSwedenSwitzerlandSyrian Arab RepublicTajikistanTanzaniaThailandTimor-LesteTogoTongaTrinidad and TobagoTunisiaTurkeyTurkmenistanTurks and Caicos IslandsTuvaluUgandaUkraineUnited Arab EmiratesUnited KingdomUnited StatesUpper middle incomeUruguayUzbekistanVanuatuVenezuela, RBVietnamVirgin Islands (U.S.)WorldYemen, Rep.ZambiaZimbabwe Timeline:
This timeline shows a graph from 1971 to 2009 of Burundi. No data until 1970. Number of actual observations by date: 39.
Source name:
World Development Indicators
Source organization:
World Bank staff estimates from original source: European Commission, Joint Research Centre (JRC)/Netherlands Environmental Assessment Agency (PBL). Emission Database for Global Atmospheric Research (EDGAR): http://edgar.jrc.ec.europa.eu/.
Categories, topics:
Energy & Mining, Environment
Last updated:
apr 23, 2017
Indicators value changes by year
Maximum:
25.055
jan 1, 2007
At the date of observation
Value
Absolute change
Change from previous value
jan 1, 1971
9.988
+9.988
0.0%
jan 1, 1972
9.723
-0.265
-2.65%
jan 1, 1973
9.769
+0.046
0.47%
jan 1, 1974
9.239
-0.53
-5.42%
jan 1, 1975
9.698
+0.459
4.96%
jan 1, 1976
9.206
-0.492
-5.07%
jan 1, 1977
9.187
-0.019
-0.21%
jan 1, 1978
9.21
+0.023
0.25%
jan 1, 1979
9.709
+0.499
5.42%
jan 1, 1980
9.804
+0.095
0.98%
jan 1, 1981
11.253
+1.45
14.79%
jan 1, 1982
12.734
+1.481
13.16%
jan 1, 1983
13.238
+0.503
3.95%
jan 1, 1984
13.52
+0.283
2.14%
jan 1, 1985
14.551
+1.031
7.63%
jan 1, 1986
14.221
-0.331
-2.27%
jan 1, 1987
13.487
-0.734
-5.16%
jan 1, 1988
14.179
+0.692
5.13%
jan 1, 1989
13.984
-0.195
-1.38%
jan 1, 1990
15.536
+1.553
11.1%
jan 1, 1991
14.277
-1.259
-8.1%
jan 1, 1992
14.309
+0.032
0.22%
jan 1, 1993
13.97
-0.339
-2.37%
jan 1, 1994
14.387
+0.417
2.99%
jan 1, 1995
18.356
+3.969
27.59%
jan 1, 1996
18.64
+0.284
1.55%
jan 1, 1997
20.418
+1.778
9.54%
jan 1, 1998
21.753
+1.335
6.54%
jan 1, 1999
21.637
-0.116
-0.54%
jan 1, 2000
16.923
-4.714
-21.79%
jan 1, 2001
18.338
+1.415
8.36%
jan 1, 2002
23.541
+5.203
28.37%
jan 1, 2003
24.071
+0.53
2.25%
jan 1, 2004
23.88
-0.191
-0.79%
jan 1, 2005
24.432
+0.552
2.31%
jan 1, 2006
24.349
-0.083
-0.34%
jan 1, 2007
25.055
+0.706
2.9%
jan 1, 2008
25.055
0.0
0.0%
jan 1, 2009
24.986
-0.069
-0.28%
Ranking of countries by current statistics by years


Comments: