29
/
en
AIzaSyAYiBZKx7MnpbEhh9jyipgxe19OcubqV5w
April 1, 2024
48112
Middle East & North Africa
MEA
false
2
1
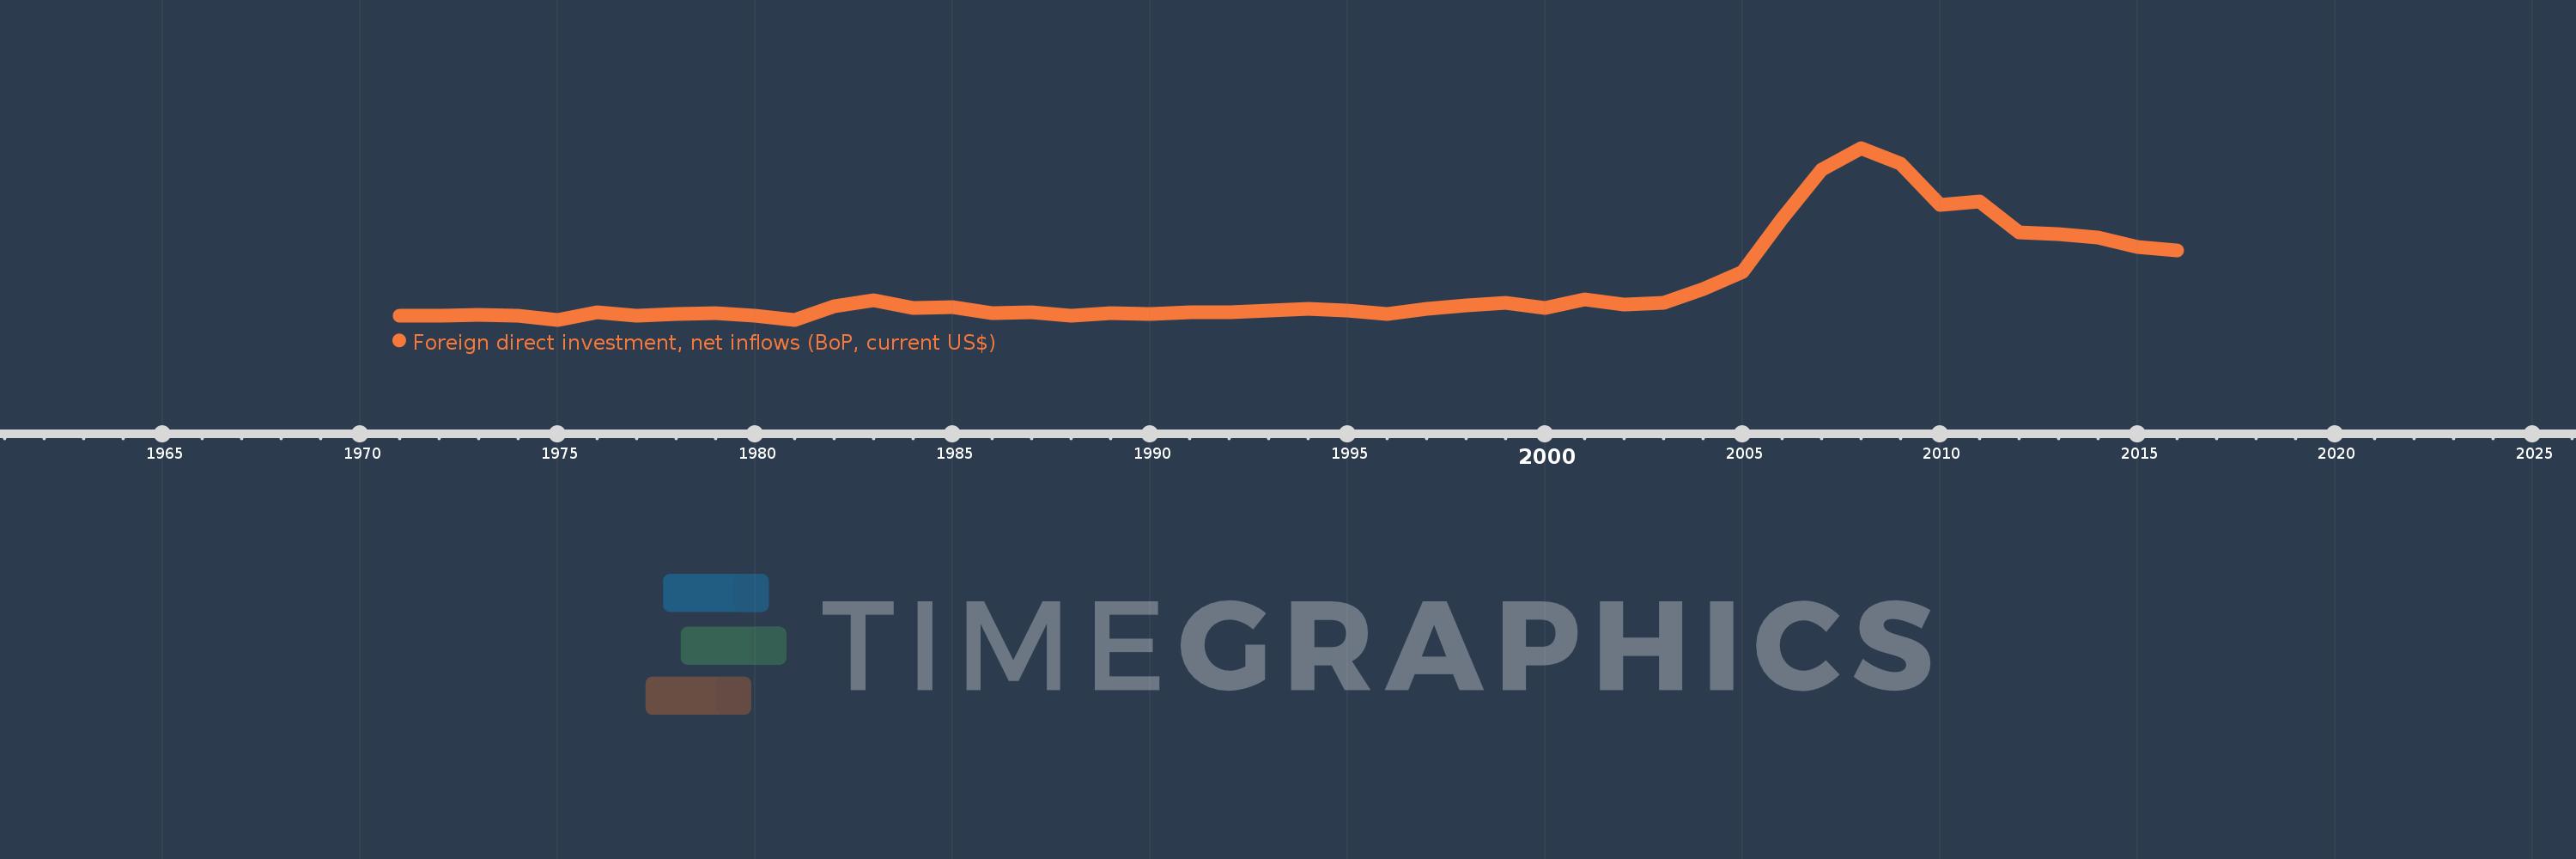
Foreign direct investment, net inflows (BoP, current US$)
2016,2015,2014,2013,2012,2011,2010,2009,2008,2007,2006,2005,2004,2003,2002,2001,2000,1999,1998,1997,1996,1995,1994,1993,1992,1991,1990,1989,1988,1987,1986,1985,1984,1983,1982,1981,1980,1979,1978,1977,1976,1975,1974,1973,1972,1971
This statistics in other country:
AfghanistanAlbaniaAlgeriaAngolaAntigua and BarbudaArab WorldArgentinaArmeniaArubaAustraliaAustriaAzerbaijanBahamas, TheBahrainBangladeshBarbadosBelarusBelgiumBelizeBeninBermudaBhutanBoliviaBosnia and HerzegovinaBotswanaBrazilBritish Virgin IslandsBrunei DarussalamBulgariaBurkina FasoBurundiCabo VerdeCambodiaCameroonCanadaCaribbean small statesCayman IslandsCentral African RepublicCentral Europe and the BalticsChadChileChinaColombiaComorosCongo, Dem. Rep.Congo, Rep.Costa RicaCote d'IvoireCroatiaCuracaoCyprusCzech RepublicDenmarkDjiboutiDominicaDominican RepublicEarly-demographic dividendEast Asia & PacificEast Asia & Pacific (excluding high income)East Asia & Pacific (IDA & IBRD countries)EcuadorEgypt, Arab Rep.El SalvadorEquatorial GuineaEritreaEstoniaEthiopiaEuro areaEurope & Central AsiaEurope & Central Asia (excluding high income)Europe & Central Asia (IDA & IBRD countries)European UnionFijiFinlandFragile and conflict affected situationsFranceFrench PolynesiaGabonGambia, TheGeorgiaGermanyGhanaGibraltarGreeceGrenadaGuatemalaGuineaGuinea-BissauGuyanaHaitiHeavily indebted poor countries (HIPC)High incomeHondurasHong Kong SAR, ChinaHungaryIBRD onlyIcelandIDA & IBRD totalIDA blendIDA onlyIDA totalIndiaIndonesiaIran, Islamic Rep.IraqIrelandIsraelItalyJamaicaJapanJordanKazakhstanKenyaKiribatiKorea, Dem. People’s Rep.Korea, Rep.KosovoKuwaitKyrgyz RepublicLao PDRLate-demographic dividendLatin America & Caribbean Latin America & Caribbean (excluding high income)Latin America & the Caribbean (IDA & IBRD countries)LatviaLeast developed countries: UN classificationLebanonLesothoLiberiaLibyaLithuaniaLow & middle incomeLow incomeLower middle incomeLuxembourgMacao SAR, ChinaMacedonia, FYRMadagascarMalawiMalaysiaMaldivesMaliMaltaMarshall IslandsMauritaniaMauritiusMexicoMicronesia, Fed. Sts.Middle East & North AfricaMiddle East & North Africa (excluding high income)Middle East & North Africa (IDA & IBRD countries)Middle incomeMoldovaMongoliaMontenegroMoroccoMozambiqueMyanmarNamibiaNauruNepalNetherlandsNew CaledoniaNew ZealandNicaraguaNigerNigeriaNorth AmericaNorthern Mariana IslandsNorwayOECD membersOmanOther small statesPacific island small statesPakistanPalauPanamaPapua New GuineaParaguayPeruPhilippinesPolandPortugalPost-demographic dividendPre-demographic dividendQatarRomaniaRussian FederationRwandaSamoaSao Tome and PrincipeSaudi ArabiaSenegalSerbiaSeychellesSierra LeoneSingaporeSint Maarten (Dutch part)Slovak RepublicSloveniaSmall statesSolomon IslandsSomaliaSouth AfricaSouth AsiaSouth Asia (IDA & IBRD)South SudanSpainSri LankaSt. Kitts and NevisSt. LuciaSt. Vincent and the GrenadinesSub-Saharan Africa Sub-Saharan Africa (excluding high income)Sub-Saharan Africa (IDA & IBRD countries)SudanSurinameSwazilandSwedenSwitzerlandSyrian Arab RepublicTajikistanTanzaniaThailandTimor-LesteTogoTongaTrinidad and TobagoTunisiaTurkeyTurkmenistanTuvaluUgandaUkraineUnited Arab EmiratesUnited KingdomUnited StatesUpper middle incomeUruguayUzbekistanVanuatuVenezuela, RBVietnamWest Bank and GazaWorldYemen, Rep.ZambiaZimbabwe Timeline:
This timeline shows a graph from 1971 to 2016 of Middle East & North Africa. No data until 1970. Number of actual observations by date: 46.
Source name:
World Development Indicators
Source organization:
International Monetary Fund, Balance of Payments database, supplemented by data from the United Nations Conference on Trade and Development and official national sources.
Categories, topics:
Economy & Growth, Financial Sector, External Debt
Last updated:
apr 23, 2017
Indicators value changes by year
Minimum:
-3.077 bln
jan 1, 1981
Maximum:
126.454 bln
jan 1, 2008
At the date of observation
Value
Absolute change
Change from previous value
jan 1, 1971
225.95 mln
+225.95 mln
0.0%
jan 1, 1972
79.848 mln
-146.102 mln
-64.66%
jan 1, 1973
310.643 mln
+230.795 mln
289.04%
jan 1, 1974
151.682 mln
-158.961 mln
-51.17%
jan 1, 1975
-3.025 bln
-3.177 bln
-2.09K%
jan 1, 1976
2.658 bln
+5.683 bln
-187.87%
jan 1, 1977
25.157 mln
-2.633 bln
-99.05%
jan 1, 1978
1.341 bln
+1.316 bln
5.23K%
jan 1, 1979
1.594 bln
+252.789 mln
18.85%
jan 1, 1980
-6.935 mln
-1.601 bln
-100.44%
jan 1, 1981
-3.077 bln
-3.07 bln
44.27K%
jan 1, 1982
7.255 bln
+10.333 bln
-335.79%
jan 1, 1983
11.674 bln
+4.418 bln
60.9%
jan 1, 1984
5.664 bln
-6.01 bln
-51.48%
jan 1, 1985
6.402 bln
+738.485 mln
13.04%
jan 1, 1986
2.107 bln
-4.296 bln
-67.09%
jan 1, 1987
2.377 bln
+269.937 mln
12.81%
jan 1, 1988
-121.305 mln
-2.498 bln
-105.1%
jan 1, 1989
2.036 bln
+2.158 bln
-1.78K%
jan 1, 1990
1.537 bln
-499.04 mln
-24.51%
jan 1, 1991
2.632 bln
+1.095 bln
71.23%
jan 1, 1992
2.552 bln
-79.732 mln
-3.03%
jan 1, 1993
4.097 bln
+1.545 bln
60.52%
jan 1, 1994
5.175 bln
+1.078 bln
26.3%
jan 1, 1995
3.861 bln
-1.314 bln
-25.39%
jan 1, 1996
1.489 bln
-2.372 bln
-61.44%
jan 1, 1997
5.014 bln
+3.525 bln
236.78%
jan 1, 1998
7.768 bln
+2.753 bln
54.91%
jan 1, 1999
9.891 bln
+2.123 bln
27.33%
jan 1, 2000
5.837 bln
-4.054 bln
-40.99%
jan 1, 2001
12.186 bln
+6.349 bln
108.77%
jan 1, 2002
8.163 bln
-4.023 bln
-33.01%
jan 1, 2003
9.581 bln
+1.418 bln
17.37%
jan 1, 2004
20.255 bln
+10.674 bln
111.4%
jan 1, 2005
32.8 bln
+12.545 bln
61.93%
jan 1, 2006
73.129 bln
+40.329 bln
122.95%
jan 1, 2007
109.955 bln
+36.826 bln
50.36%
jan 1, 2008
126.454 bln
+16.499 bln
15.0%
jan 1, 2009
114.355 bln
-12.098 bln
-9.57%
jan 1, 2010
83.675 bln
-30.68 bln
-26.83%
jan 1, 2011
86.093 bln
+2.417 bln
2.89%
jan 1, 2012
62.774 bln
-23.318 bln
-27.08%
jan 1, 2013
61.339 bln
-1.435 bln
-2.29%
jan 1, 2014
58.598 bln
-2.741 bln
-4.47%
jan 1, 2015
52.012 bln
-6.586 bln
-11.24%
jan 1, 2016
49.003 bln
-3.009 bln
-5.78%
Ranking of countries by current statistics by years


Comments: