29
/
en
AIzaSyAYiBZKx7MnpbEhh9jyipgxe19OcubqV5w
April 1, 2024
27272
East Asia & Pacific
EAS
false
2
1
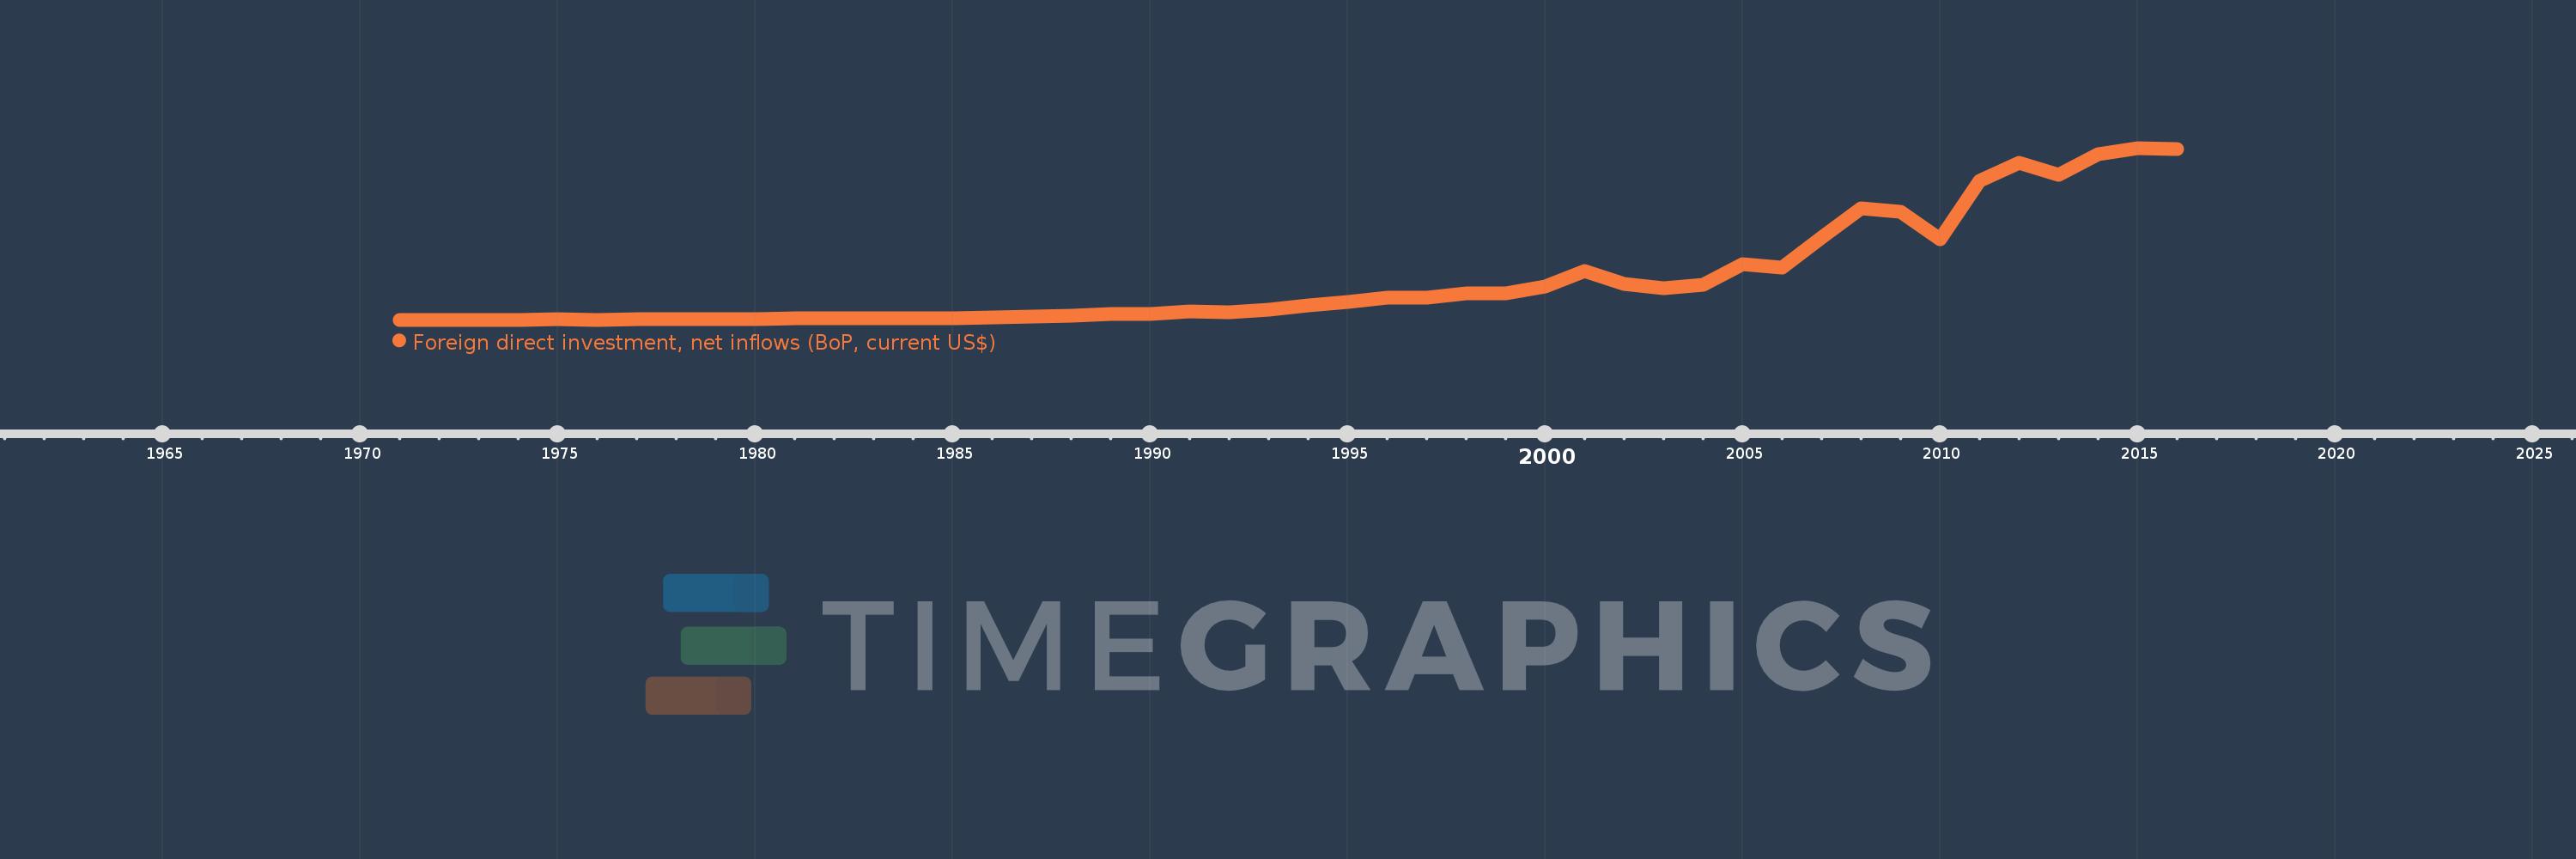
Foreign direct investment, net inflows (BoP, current US$)
2016,2015,2014,2013,2012,2011,2010,2009,2008,2007,2006,2005,2004,2003,2002,2001,2000,1999,1998,1997,1996,1995,1994,1993,1992,1991,1990,1989,1988,1987,1986,1985,1984,1983,1982,1981,1980,1979,1978,1977,1976,1975,1974,1973,1972,1971
This statistics in other country:
AfghanistanAlbaniaAlgeriaAngolaAntigua and BarbudaArab WorldArgentinaArmeniaArubaAustraliaAustriaAzerbaijanBahamas, TheBahrainBangladeshBarbadosBelarusBelgiumBelizeBeninBermudaBhutanBoliviaBosnia and HerzegovinaBotswanaBrazilBritish Virgin IslandsBrunei DarussalamBulgariaBurkina FasoBurundiCabo VerdeCambodiaCameroonCanadaCaribbean small statesCayman IslandsCentral African RepublicCentral Europe and the BalticsChadChileChinaColombiaComorosCongo, Dem. Rep.Congo, Rep.Costa RicaCote d'IvoireCroatiaCuracaoCyprusCzech RepublicDenmarkDjiboutiDominicaDominican RepublicEarly-demographic dividendEast Asia & PacificEast Asia & Pacific (excluding high income)East Asia & Pacific (IDA & IBRD countries)EcuadorEgypt, Arab Rep.El SalvadorEquatorial GuineaEritreaEstoniaEthiopiaEuro areaEurope & Central AsiaEurope & Central Asia (excluding high income)Europe & Central Asia (IDA & IBRD countries)European UnionFijiFinlandFragile and conflict affected situationsFranceFrench PolynesiaGabonGambia, TheGeorgiaGermanyGhanaGibraltarGreeceGrenadaGuatemalaGuineaGuinea-BissauGuyanaHaitiHeavily indebted poor countries (HIPC)High incomeHondurasHong Kong SAR, ChinaHungaryIBRD onlyIcelandIDA & IBRD totalIDA blendIDA onlyIDA totalIndiaIndonesiaIran, Islamic Rep.IraqIrelandIsraelItalyJamaicaJapanJordanKazakhstanKenyaKiribatiKorea, Dem. People’s Rep.Korea, Rep.KosovoKuwaitKyrgyz RepublicLao PDRLate-demographic dividendLatin America & Caribbean Latin America & Caribbean (excluding high income)Latin America & the Caribbean (IDA & IBRD countries)LatviaLeast developed countries: UN classificationLebanonLesothoLiberiaLibyaLithuaniaLow & middle incomeLow incomeLower middle incomeLuxembourgMacao SAR, ChinaMacedonia, FYRMadagascarMalawiMalaysiaMaldivesMaliMaltaMarshall IslandsMauritaniaMauritiusMexicoMicronesia, Fed. Sts.Middle East & North AfricaMiddle East & North Africa (excluding high income)Middle East & North Africa (IDA & IBRD countries)Middle incomeMoldovaMongoliaMontenegroMoroccoMozambiqueMyanmarNamibiaNauruNepalNetherlandsNew CaledoniaNew ZealandNicaraguaNigerNigeriaNorth AmericaNorthern Mariana IslandsNorwayOECD membersOmanOther small statesPacific island small statesPakistanPalauPanamaPapua New GuineaParaguayPeruPhilippinesPolandPortugalPost-demographic dividendPre-demographic dividendQatarRomaniaRussian FederationRwandaSamoaSao Tome and PrincipeSaudi ArabiaSenegalSerbiaSeychellesSierra LeoneSingaporeSint Maarten (Dutch part)Slovak RepublicSloveniaSmall statesSolomon IslandsSomaliaSouth AfricaSouth AsiaSouth Asia (IDA & IBRD)South SudanSpainSri LankaSt. Kitts and NevisSt. LuciaSt. Vincent and the GrenadinesSub-Saharan Africa Sub-Saharan Africa (excluding high income)Sub-Saharan Africa (IDA & IBRD countries)SudanSurinameSwazilandSwedenSwitzerlandSyrian Arab RepublicTajikistanTanzaniaThailandTimor-LesteTogoTongaTrinidad and TobagoTunisiaTurkeyTurkmenistanTuvaluUgandaUkraineUnited Arab EmiratesUnited KingdomUnited StatesUpper middle incomeUruguayUzbekistanVanuatuVenezuela, RBVietnamWest Bank and GazaWorldYemen, Rep.ZambiaZimbabwe Timeline:
This timeline shows a graph from 1971 to 2016 of East Asia & Pacific. No data until 1970. Number of actual observations by date: 46.
Source name:
World Development Indicators
Source organization:
International Monetary Fund, Balance of Payments database, supplemented by data from the United Nations Conference on Trade and Development and official national sources.
Categories, topics:
Economy & Growth, Financial Sector, External Debt
Last updated:
apr 23, 2017
Indicators value changes by year
Minimum:
1.127 bln
jan 1, 1974
Maximum:
612.38 bln
jan 1, 2015
At the date of observation
Value
Absolute change
Change from previous value
jan 1, 1971
1.422 bln
+1.422 bln
0.0%
jan 1, 1972
1.599 bln
+176.741 mln
12.43%
jan 1, 1973
1.548 bln
-50.964 mln
-3.19%
jan 1, 1974
1.127 bln
-420.503 mln
-27.17%
jan 1, 1975
2.785 bln
+1.658 bln
147.1%
jan 1, 1976
1.486 bln
-1.299 bln
-46.65%
jan 1, 1977
2.354 bln
+867.766 mln
58.4%
jan 1, 1978
2.502 bln
+148.373 mln
6.3%
jan 1, 1979
3.173 bln
+671.266 mln
26.83%
jan 1, 1980
3.778 bln
+604.72 mln
19.06%
jan 1, 1981
4.877 bln
+1.099 bln
29.08%
jan 1, 1982
6.734 bln
+1.857 bln
38.08%
jan 1, 1983
7.314 bln
+579.876 mln
8.61%
jan 1, 1984
7.755 bln
+441.395 mln
6.04%
jan 1, 1985
6.095 bln
-1.66 bln
-21.4%
jan 1, 1986
8.558 bln
+2.462 bln
40.4%
jan 1, 1987
12.394 bln
+3.836 bln
44.83%
jan 1, 1988
15.818 bln
+3.424 bln
27.63%
jan 1, 1989
21.078 bln
+5.26 bln
33.25%
jan 1, 1990
22.425 bln
+1.347 bln
6.39%
jan 1, 1991
29.808 bln
+7.383 bln
32.92%
jan 1, 1992
27.586 bln
-2.222 bln
-7.45%
jan 1, 1993
35.592 bln
+8.006 bln
29.02%
jan 1, 1994
51.949 bln
+16.357 bln
45.96%
jan 1, 1995
64.711 bln
+12.761 bln
24.56%
jan 1, 1996
81.053 bln
+16.342 bln
25.25%
jan 1, 1997
81.172 bln
+119.499 mln
0.15%
jan 1, 1998
94.78 bln
+13.608 bln
16.76%
jan 1, 1999
96.055 bln
+1.275 bln
1.35%
jan 1, 2000
120.588 bln
+24.533 bln
25.54%
jan 1, 2001
174.697 bln
+54.109 bln
44.87%
jan 1, 2002
127.669 bln
-47.028 bln
-26.92%
jan 1, 2003
112.877 bln
-14.792 bln
-11.59%
jan 1, 2004
126.791 bln
+13.915 bln
12.33%
jan 1, 2005
198.735 bln
+71.944 bln
56.74%
jan 1, 2006
187.816 bln
-10.919 bln
-5.49%
jan 1, 2007
294.794 bln
+106.978 bln
56.96%
jan 1, 2008
396.421 bln
+101.627 bln
34.47%
jan 1, 2009
385.552 bln
-10.869 bln
-2.74%
jan 1, 2010
287.309 bln
-98.243 bln
-25.48%
jan 1, 2011
496.299 bln
+208.99 bln
72.74%
jan 1, 2012
559.026 bln
+62.726 bln
12.64%
jan 1, 2013
517.957 bln
-41.068 bln
-7.35%
jan 1, 2014
591.42 bln
+73.462 bln
14.18%
jan 1, 2015
612.38 bln
+20.961 bln
3.54%
jan 1, 2016
609.668 bln
-2.713 bln
-0.44%
Ranking of countries by current statistics by years


Comments: