29
/
en
AIzaSyAYiBZKx7MnpbEhh9jyipgxe19OcubqV5w
April 1, 2024
240436
Singapore
SGP
true
2
1
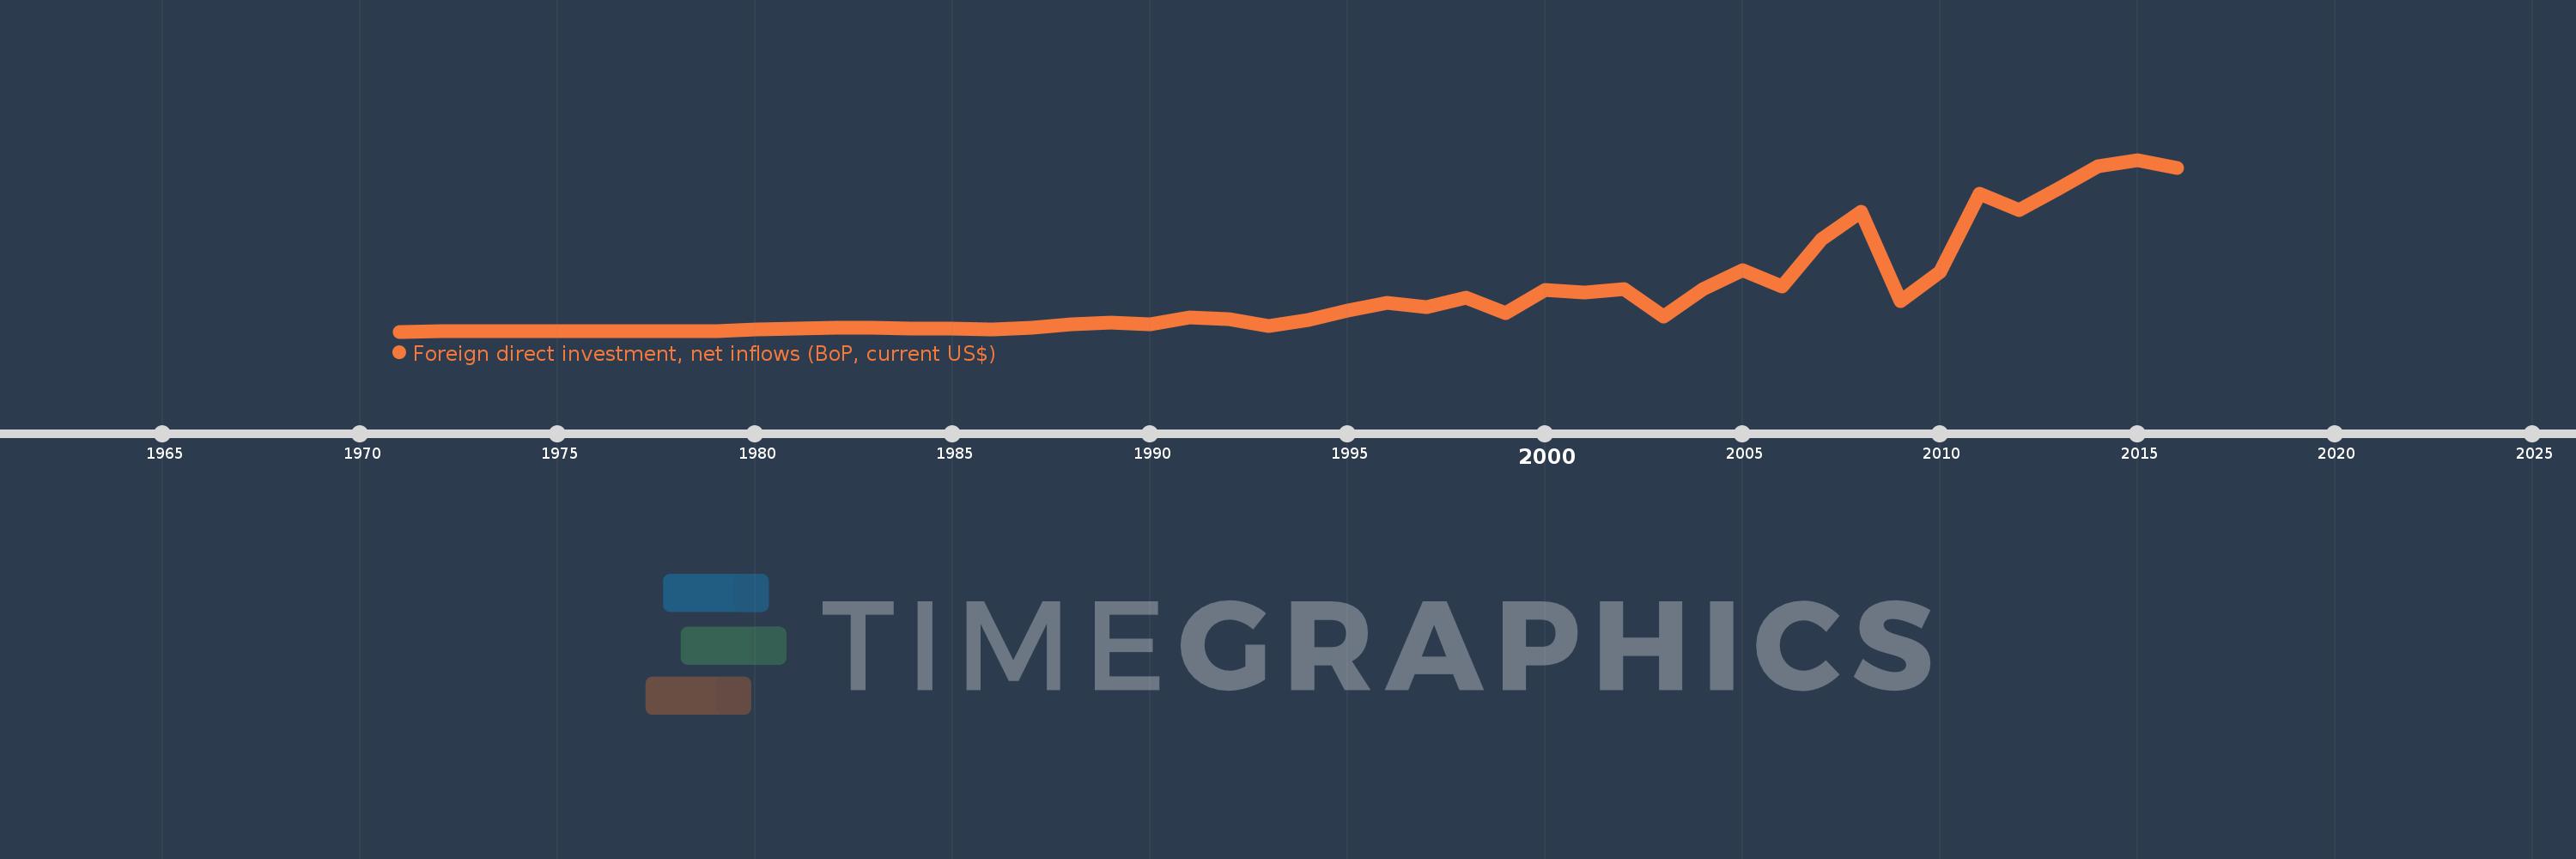
Foreign direct investment, net inflows (BoP, current US$)
2016,2015,2014,2013,2012,2011,2010,2009,2008,2007,2006,2005,2004,2003,2002,2001,2000,1999,1998,1997,1996,1995,1994,1993,1992,1991,1990,1989,1988,1987,1986,1985,1984,1983,1982,1981,1980,1979,1978,1977,1976,1975,1974,1973,1972,1971
This statistics in other country:
AfghanistanAlbaniaAlgeriaAngolaAntigua and BarbudaArab WorldArgentinaArmeniaArubaAustraliaAustriaAzerbaijanBahamas, TheBahrainBangladeshBarbadosBelarusBelgiumBelizeBeninBermudaBhutanBoliviaBosnia and HerzegovinaBotswanaBrazilBritish Virgin IslandsBrunei DarussalamBulgariaBurkina FasoBurundiCabo VerdeCambodiaCameroonCanadaCaribbean small statesCayman IslandsCentral African RepublicCentral Europe and the BalticsChadChileChinaColombiaComorosCongo, Dem. Rep.Congo, Rep.Costa RicaCote d'IvoireCroatiaCuracaoCyprusCzech RepublicDenmarkDjiboutiDominicaDominican RepublicEarly-demographic dividendEast Asia & PacificEast Asia & Pacific (excluding high income)East Asia & Pacific (IDA & IBRD countries)EcuadorEgypt, Arab Rep.El SalvadorEquatorial GuineaEritreaEstoniaEthiopiaEuro areaEurope & Central AsiaEurope & Central Asia (excluding high income)Europe & Central Asia (IDA & IBRD countries)European UnionFijiFinlandFragile and conflict affected situationsFranceFrench PolynesiaGabonGambia, TheGeorgiaGermanyGhanaGibraltarGreeceGrenadaGuatemalaGuineaGuinea-BissauGuyanaHaitiHeavily indebted poor countries (HIPC)High incomeHondurasHong Kong SAR, ChinaHungaryIBRD onlyIcelandIDA & IBRD totalIDA blendIDA onlyIDA totalIndiaIndonesiaIran, Islamic Rep.IraqIrelandIsraelItalyJamaicaJapanJordanKazakhstanKenyaKiribatiKorea, Dem. People’s Rep.Korea, Rep.KosovoKuwaitKyrgyz RepublicLao PDRLate-demographic dividendLatin America & Caribbean Latin America & Caribbean (excluding high income)Latin America & the Caribbean (IDA & IBRD countries)LatviaLeast developed countries: UN classificationLebanonLesothoLiberiaLibyaLithuaniaLow & middle incomeLow incomeLower middle incomeLuxembourgMacao SAR, ChinaMacedonia, FYRMadagascarMalawiMalaysiaMaldivesMaliMaltaMarshall IslandsMauritaniaMauritiusMexicoMicronesia, Fed. Sts.Middle East & North AfricaMiddle East & North Africa (excluding high income)Middle East & North Africa (IDA & IBRD countries)Middle incomeMoldovaMongoliaMontenegroMoroccoMozambiqueMyanmarNamibiaNauruNepalNetherlandsNew CaledoniaNew ZealandNicaraguaNigerNigeriaNorth AmericaNorthern Mariana IslandsNorwayOECD membersOmanOther small statesPacific island small statesPakistanPalauPanamaPapua New GuineaParaguayPeruPhilippinesPolandPortugalPost-demographic dividendPre-demographic dividendQatarRomaniaRussian FederationRwandaSamoaSao Tome and PrincipeSaudi ArabiaSenegalSerbiaSeychellesSierra LeoneSingaporeSint Maarten (Dutch part)Slovak RepublicSloveniaSmall statesSolomon IslandsSomaliaSouth AfricaSouth AsiaSouth Asia (IDA & IBRD)South SudanSpainSri LankaSt. Kitts and NevisSt. LuciaSt. Vincent and the GrenadinesSub-Saharan Africa Sub-Saharan Africa (excluding high income)Sub-Saharan Africa (IDA & IBRD countries)SudanSurinameSwazilandSwedenSwitzerlandSyrian Arab RepublicTajikistanTanzaniaThailandTimor-LesteTogoTongaTrinidad and TobagoTunisiaTurkeyTurkmenistanTuvaluUgandaUkraineUnited Arab EmiratesUnited KingdomUnited StatesUpper middle incomeUruguayUzbekistanVanuatuVenezuela, RBVietnamWest Bank and GazaWorldYemen, Rep.ZambiaZimbabwe Timeline:
This timeline shows a graph from 1971 to 2016 of Singapore. No data until 1970. Number of actual observations by date: 46.
Source name:
World Development Indicators
Source organization:
International Monetary Fund, Balance of Payments database, supplemented by data from the United Nations Conference on Trade and Development and official national sources.
Categories, topics:
Economy & Growth, Financial Sector, External Debt
Last updated:
apr 23, 2017
Indicators value changes by year
Minimum:
93.0 mln
jan 1, 1971
Maximum:
68.496 bln
jan 1, 2015
At the date of observation
Value
Absolute change
Change from previous value
jan 1, 1971
93.0 mln
+93.0 mln
0.0%
jan 1, 1972
116.0 mln
+23.0 mln
24.73%
jan 1, 1973
161.067 mln
+45.067 mln
38.85%
jan 1, 1974
352.817 mln
+191.75 mln
119.05%
jan 1, 1975
340.191 mln
-12.626 mln
-3.58%
jan 1, 1976
291.823 mln
-48.368 mln
-14.22%
jan 1, 1977
230.691 mln
-61.132 mln
-20.95%
jan 1, 1978
291.465 mln
+60.774 mln
26.34%
jan 1, 1979
299.909 mln
+8.444 mln
2.9%
jan 1, 1980
836.032 mln
+536.123 mln
178.76%
jan 1, 1981
1.236 bln
+399.719 mln
47.81%
jan 1, 1982
1.66 bln
+424.217 mln
34.33%
jan 1, 1983
1.602 bln
-58.117 mln
-3.5%
jan 1, 1984
1.134 bln
-467.944 mln
-29.21%
jan 1, 1985
1.302 bln
+167.965 mln
14.81%
jan 1, 1986
1.047 bln
-255.125 mln
-19.6%
jan 1, 1987
1.71 bln
+663.537 mln
63.39%
jan 1, 1988
2.836 bln
+1.126 bln
65.83%
jan 1, 1989
3.655 bln
+818.59 mln
28.86%
jan 1, 1990
2.887 bln
-768.203 mln
-21.02%
jan 1, 1991
5.575 bln
+2.688 bln
93.13%
jan 1, 1992
4.887 bln
-687.644 mln
-12.34%
jan 1, 1993
2.204 bln
-2.683 bln
-54.89%
jan 1, 1994
4.686 bln
+2.482 bln
112.59%
jan 1, 1995
8.55 bln
+3.864 bln
82.45%
jan 1, 1996
11.535 bln
+2.985 bln
34.91%
jan 1, 1997
9.682 bln
-1.853 bln
-16.06%
jan 1, 1998
13.753 bln
+4.071 bln
42.04%
jan 1, 1999
7.314 bln
-6.439 bln
-46.82%
jan 1, 2000
16.578 bln
+9.264 bln
126.66%
jan 1, 2001
15.515 bln
-1.063 bln
-6.41%
jan 1, 2002
17.007 bln
+1.492 bln
9.61%
jan 1, 2003
6.157 bln
-10.85 bln
-63.8%
jan 1, 2004
17.051 bln
+10.894 bln
176.93%
jan 1, 2005
24.39 bln
+7.339 bln
43.04%
jan 1, 2006
18.09 bln
-6.3 bln
-25.83%
jan 1, 2007
36.924 bln
+18.834 bln
104.11%
jan 1, 2008
47.733 bln
+10.809 bln
29.27%
jan 1, 2009
12.201 bln
-35.533 bln
-74.44%
jan 1, 2010
23.821 bln
+11.621 bln
95.24%
jan 1, 2011
55.076 bln
+31.255 bln
131.21%
jan 1, 2012
48.329 bln
-6.747 bln
-12.25%
jan 1, 2013
57.15 bln
+8.821 bln
18.25%
jan 1, 2014
66.067 bln
+8.917 bln
15.6%
jan 1, 2015
68.496 bln
+2.429 bln
3.68%
jan 1, 2016
65.263 bln
-3.233 bln
-4.72%
Ranking of countries by current statistics by years


Comments: