29
/
en
AIzaSyAYiBZKx7MnpbEhh9jyipgxe19OcubqV5w
April 1, 2024
269311
Turkey
TUR
true
2
1
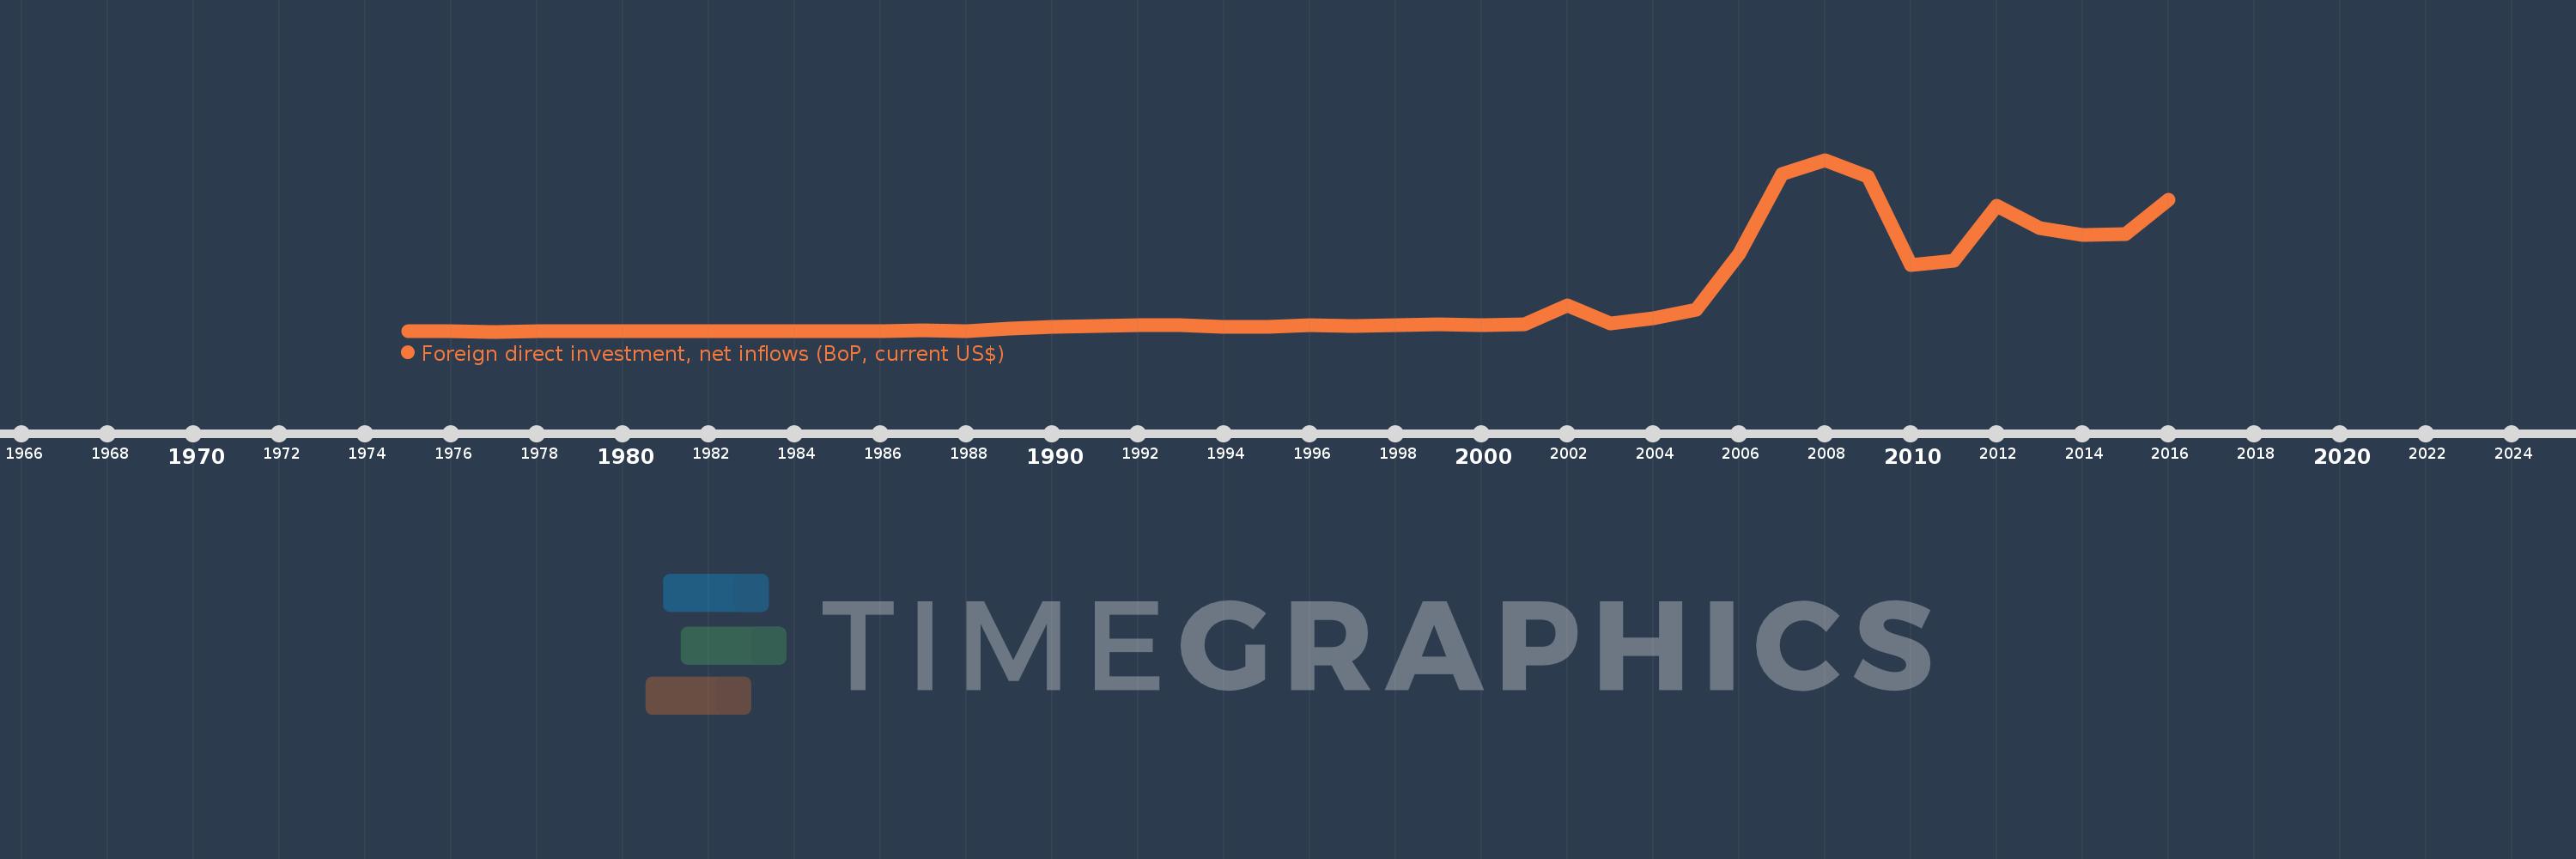
Foreign direct investment, net inflows (BoP, current US$)
2016,2015,2014,2013,2012,2011,2010,2009,2008,2007,2006,2005,2004,2003,2002,2001,2000,1999,1998,1997,1996,1995,1994,1993,1992,1991,1990,1989,1988,1987,1986,1985,1984,1983,1982,1981,1980,1979,1978,1977,1976,1975
This statistics in other country:
AfghanistanAlbaniaAlgeriaAngolaAntigua and BarbudaArab WorldArgentinaArmeniaArubaAustraliaAustriaAzerbaijanBahamas, TheBahrainBangladeshBarbadosBelarusBelgiumBelizeBeninBermudaBhutanBoliviaBosnia and HerzegovinaBotswanaBrazilBritish Virgin IslandsBrunei DarussalamBulgariaBurkina FasoBurundiCabo VerdeCambodiaCameroonCanadaCaribbean small statesCayman IslandsCentral African RepublicCentral Europe and the BalticsChadChileChinaColombiaComorosCongo, Dem. Rep.Congo, Rep.Costa RicaCote d'IvoireCroatiaCuracaoCyprusCzech RepublicDenmarkDjiboutiDominicaDominican RepublicEarly-demographic dividendEast Asia & PacificEast Asia & Pacific (excluding high income)East Asia & Pacific (IDA & IBRD countries)EcuadorEgypt, Arab Rep.El SalvadorEquatorial GuineaEritreaEstoniaEthiopiaEuro areaEurope & Central AsiaEurope & Central Asia (excluding high income)Europe & Central Asia (IDA & IBRD countries)European UnionFijiFinlandFragile and conflict affected situationsFranceFrench PolynesiaGabonGambia, TheGeorgiaGermanyGhanaGibraltarGreeceGrenadaGuatemalaGuineaGuinea-BissauGuyanaHaitiHeavily indebted poor countries (HIPC)High incomeHondurasHong Kong SAR, ChinaHungaryIBRD onlyIcelandIDA & IBRD totalIDA blendIDA onlyIDA totalIndiaIndonesiaIran, Islamic Rep.IraqIrelandIsraelItalyJamaicaJapanJordanKazakhstanKenyaKiribatiKorea, Dem. People’s Rep.Korea, Rep.KosovoKuwaitKyrgyz RepublicLao PDRLate-demographic dividendLatin America & Caribbean Latin America & Caribbean (excluding high income)Latin America & the Caribbean (IDA & IBRD countries)LatviaLeast developed countries: UN classificationLebanonLesothoLiberiaLibyaLithuaniaLow & middle incomeLow incomeLower middle incomeLuxembourgMacao SAR, ChinaMacedonia, FYRMadagascarMalawiMalaysiaMaldivesMaliMaltaMarshall IslandsMauritaniaMauritiusMexicoMicronesia, Fed. Sts.Middle East & North AfricaMiddle East & North Africa (excluding high income)Middle East & North Africa (IDA & IBRD countries)Middle incomeMoldovaMongoliaMontenegroMoroccoMozambiqueMyanmarNamibiaNauruNepalNetherlandsNew CaledoniaNew ZealandNicaraguaNigerNigeriaNorth AmericaNorthern Mariana IslandsNorwayOECD membersOmanOther small statesPacific island small statesPakistanPalauPanamaPapua New GuineaParaguayPeruPhilippinesPolandPortugalPost-demographic dividendPre-demographic dividendQatarRomaniaRussian FederationRwandaSamoaSao Tome and PrincipeSaudi ArabiaSenegalSerbiaSeychellesSierra LeoneSingaporeSint Maarten (Dutch part)Slovak RepublicSloveniaSmall statesSolomon IslandsSomaliaSouth AfricaSouth AsiaSouth Asia (IDA & IBRD)South SudanSpainSri LankaSt. Kitts and NevisSt. LuciaSt. Vincent and the GrenadinesSub-Saharan Africa Sub-Saharan Africa (excluding high income)Sub-Saharan Africa (IDA & IBRD countries)SudanSurinameSwazilandSwedenSwitzerlandSyrian Arab RepublicTajikistanTanzaniaThailandTimor-LesteTogoTongaTrinidad and TobagoTunisiaTurkeyTurkmenistanTuvaluUgandaUkraineUnited Arab EmiratesUnited KingdomUnited StatesUpper middle incomeUruguayUzbekistanVanuatuVenezuela, RBVietnamWest Bank and GazaWorldYemen, Rep.ZambiaZimbabwe Timeline:
This timeline shows a graph from 1975 to 2016 of Turkey. No data until 1974. Number of actual observations by date: 42.
Source name:
World Development Indicators
Source organization:
International Monetary Fund, Balance of Payments database, supplemented by data from the United Nations Conference on Trade and Development and official national sources.
Categories, topics:
Economy & Growth, Financial Sector, External Debt
Last updated:
apr 23, 2017
Indicators value changes by year
Minimum:
10.0 mln
jan 1, 1977
Maximum:
22.047 bln
jan 1, 2008
At the date of observation
Value
Absolute change
Change from previous value
jan 1, 1975
64.0 mln
+64.0 mln
0.0%
jan 1, 1976
114.0 mln
+50.0 mln
78.13%
jan 1, 1977
10.0 mln
-104.0 mln
-91.23%
jan 1, 1978
27.0 mln
+17.0 mln
170.0%
jan 1, 1979
34.0 mln
+7.0 mln
25.93%
jan 1, 1980
75.0 mln
+41.0 mln
120.59%
jan 1, 1981
18.0 mln
-57.0 mln
-76.0%
jan 1, 1982
95.0 mln
+77.0 mln
427.78%
jan 1, 1983
55.0 mln
-40.0 mln
-42.11%
jan 1, 1984
46.0 mln
-9.0 mln
-16.36%
jan 1, 1985
113.0 mln
+67.0 mln
145.65%
jan 1, 1986
99.0 mln
-14.0 mln
-12.39%
jan 1, 1987
125.0 mln
+26.0 mln
26.26%
jan 1, 1988
115.0 mln
-10.0 mln
-8.0%
jan 1, 1989
354.0 mln
+239.0 mln
207.83%
jan 1, 1990
663.0 mln
+309.0 mln
87.29%
jan 1, 1991
684.0 mln
+21.0 mln
3.17%
jan 1, 1992
810.0 mln
+126.0 mln
18.42%
jan 1, 1993
844.0 mln
+34.0 mln
4.2%
jan 1, 1994
636.0 mln
-208.0 mln
-24.64%
jan 1, 1995
608.0 mln
-28.0 mln
-4.4%
jan 1, 1996
885.0 mln
+277.0 mln
45.56%
jan 1, 1997
722.0 mln
-163.0 mln
-18.42%
jan 1, 1998
805.0 mln
+83.0 mln
11.5%
jan 1, 1999
940.0 mln
+135.0 mln
16.77%
jan 1, 2000
783.0 mln
-157.0 mln
-16.7%
jan 1, 2001
982.0 mln
+199.0 mln
25.42%
jan 1, 2002
3.352 bln
+2.37 bln
241.34%
jan 1, 2003
1.082 bln
-2.27 bln
-67.72%
jan 1, 2004
1.702 bln
+620.0 mln
57.3%
jan 1, 2005
2.785 bln
+1.083 bln
63.63%
jan 1, 2006
10.031 bln
+7.246 bln
260.18%
jan 1, 2007
20.185 bln
+10.154 bln
101.23%
jan 1, 2008
22.047 bln
+1.862 bln
9.22%
jan 1, 2009
19.851 bln
-2.196 bln
-9.96%
jan 1, 2010
8.585 bln
-11.266 bln
-56.75%
jan 1, 2011
9.099 bln
+514.0 mln
5.99%
jan 1, 2012
16.182 bln
+7.083 bln
77.84%
jan 1, 2013
13.284 bln
-2.898 bln
-17.91%
jan 1, 2014
12.384 bln
-900.0 mln
-6.78%
jan 1, 2015
12.523 bln
+139.0 mln
1.12%
jan 1, 2016
16.957 bln
+4.434 bln
35.41%
Ranking of countries by current statistics by years


Comments: