29
/
en
AIzaSyAYiBZKx7MnpbEhh9jyipgxe19OcubqV5w
April 1, 2024
179929
Libya
LBY
true
2
1
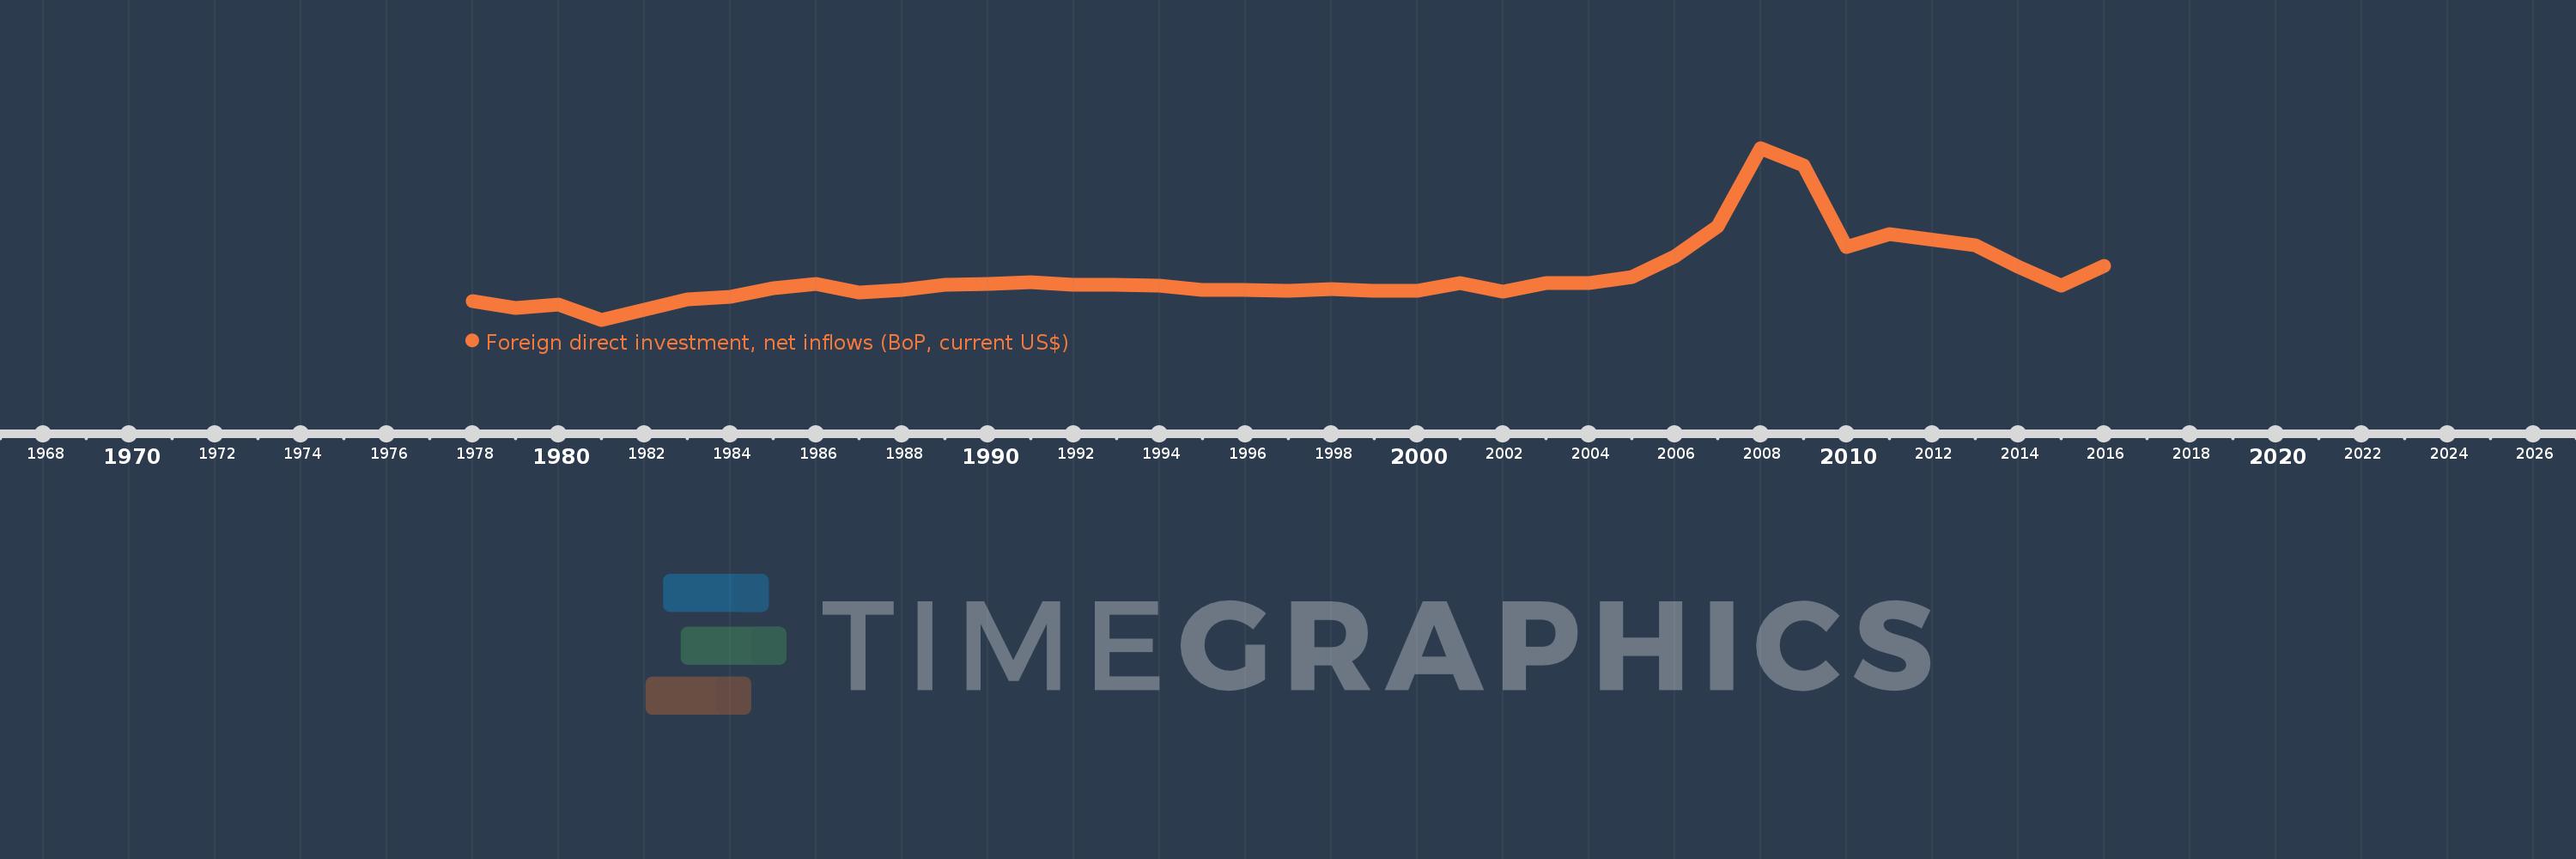
Foreign direct investment, net inflows (BoP, current US$)
2016,2015,2014,2013,2011,2010,2009,2008,2007,2006,2005,2004,2003,2002,2001,2000,1999,1998,1997,1996,1995,1994,1993,1992,1991,1990,1989,1988,1987,1986,1985,1984,1983,1982,1981,1980,1979,1978
This statistics in other country:
AfghanistanAlbaniaAlgeriaAngolaAntigua and BarbudaArab WorldArgentinaArmeniaArubaAustraliaAustriaAzerbaijanBahamas, TheBahrainBangladeshBarbadosBelarusBelgiumBelizeBeninBermudaBhutanBoliviaBosnia and HerzegovinaBotswanaBrazilBritish Virgin IslandsBrunei DarussalamBulgariaBurkina FasoBurundiCabo VerdeCambodiaCameroonCanadaCaribbean small statesCayman IslandsCentral African RepublicCentral Europe and the BalticsChadChileChinaColombiaComorosCongo, Dem. Rep.Congo, Rep.Costa RicaCote d'IvoireCroatiaCuracaoCyprusCzech RepublicDenmarkDjiboutiDominicaDominican RepublicEarly-demographic dividendEast Asia & PacificEast Asia & Pacific (excluding high income)East Asia & Pacific (IDA & IBRD countries)EcuadorEgypt, Arab Rep.El SalvadorEquatorial GuineaEritreaEstoniaEthiopiaEuro areaEurope & Central AsiaEurope & Central Asia (excluding high income)Europe & Central Asia (IDA & IBRD countries)European UnionFijiFinlandFragile and conflict affected situationsFranceFrench PolynesiaGabonGambia, TheGeorgiaGermanyGhanaGibraltarGreeceGrenadaGuatemalaGuineaGuinea-BissauGuyanaHaitiHeavily indebted poor countries (HIPC)High incomeHondurasHong Kong SAR, ChinaHungaryIBRD onlyIcelandIDA & IBRD totalIDA blendIDA onlyIDA totalIndiaIndonesiaIran, Islamic Rep.IraqIrelandIsraelItalyJamaicaJapanJordanKazakhstanKenyaKiribatiKorea, Dem. People’s Rep.Korea, Rep.KosovoKuwaitKyrgyz RepublicLao PDRLate-demographic dividendLatin America & Caribbean Latin America & Caribbean (excluding high income)Latin America & the Caribbean (IDA & IBRD countries)LatviaLeast developed countries: UN classificationLebanonLesothoLiberiaLibyaLithuaniaLow & middle incomeLow incomeLower middle incomeLuxembourgMacao SAR, ChinaMacedonia, FYRMadagascarMalawiMalaysiaMaldivesMaliMaltaMarshall IslandsMauritaniaMauritiusMexicoMicronesia, Fed. Sts.Middle East & North AfricaMiddle East & North Africa (excluding high income)Middle East & North Africa (IDA & IBRD countries)Middle incomeMoldovaMongoliaMontenegroMoroccoMozambiqueMyanmarNamibiaNauruNepalNetherlandsNew CaledoniaNew ZealandNicaraguaNigerNigeriaNorth AmericaNorthern Mariana IslandsNorwayOECD membersOmanOther small statesPacific island small statesPakistanPalauPanamaPapua New GuineaParaguayPeruPhilippinesPolandPortugalPost-demographic dividendPre-demographic dividendQatarRomaniaRussian FederationRwandaSamoaSao Tome and PrincipeSaudi ArabiaSenegalSerbiaSeychellesSierra LeoneSingaporeSint Maarten (Dutch part)Slovak RepublicSloveniaSmall statesSolomon IslandsSomaliaSouth AfricaSouth AsiaSouth Asia (IDA & IBRD)South SudanSpainSri LankaSt. Kitts and NevisSt. LuciaSt. Vincent and the GrenadinesSub-Saharan Africa Sub-Saharan Africa (excluding high income)Sub-Saharan Africa (IDA & IBRD countries)SudanSurinameSwazilandSwedenSwitzerlandSyrian Arab RepublicTajikistanTanzaniaThailandTimor-LesteTogoTongaTrinidad and TobagoTunisiaTurkeyTurkmenistanTuvaluUgandaUkraineUnited Arab EmiratesUnited KingdomUnited StatesUpper middle incomeUruguayUzbekistanVanuatuVenezuela, RBVietnamWest Bank and GazaWorldYemen, Rep.ZambiaZimbabwe Timeline:
This timeline shows a graph from 1978 to 2016 of Libya. No data until 1977. Number of actual observations by date: 38.
Source name:
World Development Indicators
Source organization:
International Monetary Fund, Balance of Payments database, supplemented by data from the United Nations Conference on Trade and Development and official national sources.
Categories, topics:
Economy & Growth, Financial Sector, External Debt
Last updated:
apr 23, 2017
Indicators value changes by year
Minimum:
-1.089 bln
jan 1, 1981
Maximum:
4.689 bln
jan 1, 2008
At the date of observation
Value
Absolute change
Change from previous value
jan 1, 1978
-451.274 mln
-451.274 mln
0.0%
jan 1, 1979
-702.582 mln
-251.308 mln
55.69%
jan 1, 1980
-587.737 mln
+114.845 mln
-16.35%
jan 1, 1981
-1.089 bln
-501.604 mln
85.34%
jan 1, 1982
-744.127 mln
+345.214 mln
-31.69%
jan 1, 1983
-391.822 mln
+352.305 mln
-47.34%
jan 1, 1984
-326.631 mln
+65.191 mln
-16.64%
jan 1, 1985
-16.889 mln
+309.742 mln
-94.83%
jan 1, 1986
119.235 mln
+136.124 mln
-806.0%
jan 1, 1987
-176.921 mln
-296.156 mln
-248.38%
jan 1, 1988
-97.634 mln
+79.287 mln
-44.81%
jan 1, 1989
97.982 mln
+195.616 mln
-200.36%
jan 1, 1990
125.166 mln
+27.184 mln
27.74%
jan 1, 1991
158.911 mln
+33.745 mln
26.96%
jan 1, 1992
91.904 mln
-67.007 mln
-42.17%
jan 1, 1993
99.093 mln
+7.189 mln
7.82%
jan 1, 1994
58.153 mln
-40.94 mln
-41.31%
jan 1, 1995
-72.624 mln
-130.777 mln
-224.89%
jan 1, 1996
-88.486 mln
-15.862 mln
21.84%
jan 1, 1997
-111.722 mln
-23.236 mln
26.26%
jan 1, 1998
-67.916 mln
+43.806 mln
-39.21%
jan 1, 1999
-127.894 mln
-59.978 mln
88.31%
jan 1, 2000
-128.069 mln
-175.397K
0.14%
jan 1, 2001
141.0 mln
+269.069 mln
-210.1%
jan 1, 2002
-133.0 mln
-274.0 mln
-194.33%
jan 1, 2003
145.0 mln
+278.0 mln
-209.02%
jan 1, 2004
143.0 mln
-2.0 mln
-1.38%
jan 1, 2005
357.0 mln
+214.0 mln
149.65%
jan 1, 2006
1.038 bln
+681.0 mln
190.76%
jan 1, 2007
2.064 bln
+1.026 bln
98.84%
jan 1, 2008
4.689 bln
+2.625 bln
127.18%
jan 1, 2009
4.111 bln
-577.7 mln
-12.32%
jan 1, 2010
1.371 bln
-2.74 bln
-66.65%
jan 1, 2011
1.784 bln
+413.0 mln
30.12%
jan 1, 2013
1.425 bln
-359.0 mln
-20.12%
jan 1, 2014
702.0 mln
-723.0 mln
-50.74%
jan 1, 2015
50.0 mln
-652.0 mln
-92.88%
jan 1, 2016
725.667 mln
+675.667 mln
1.35K%
Ranking of countries by current statistics by years


Comments: