29
/
en
AIzaSyAYiBZKx7MnpbEhh9jyipgxe19OcubqV5w
April 1, 2024
43413
Latin America & the Caribbean (IDA & IBRD countries)
TLA
false
2
1
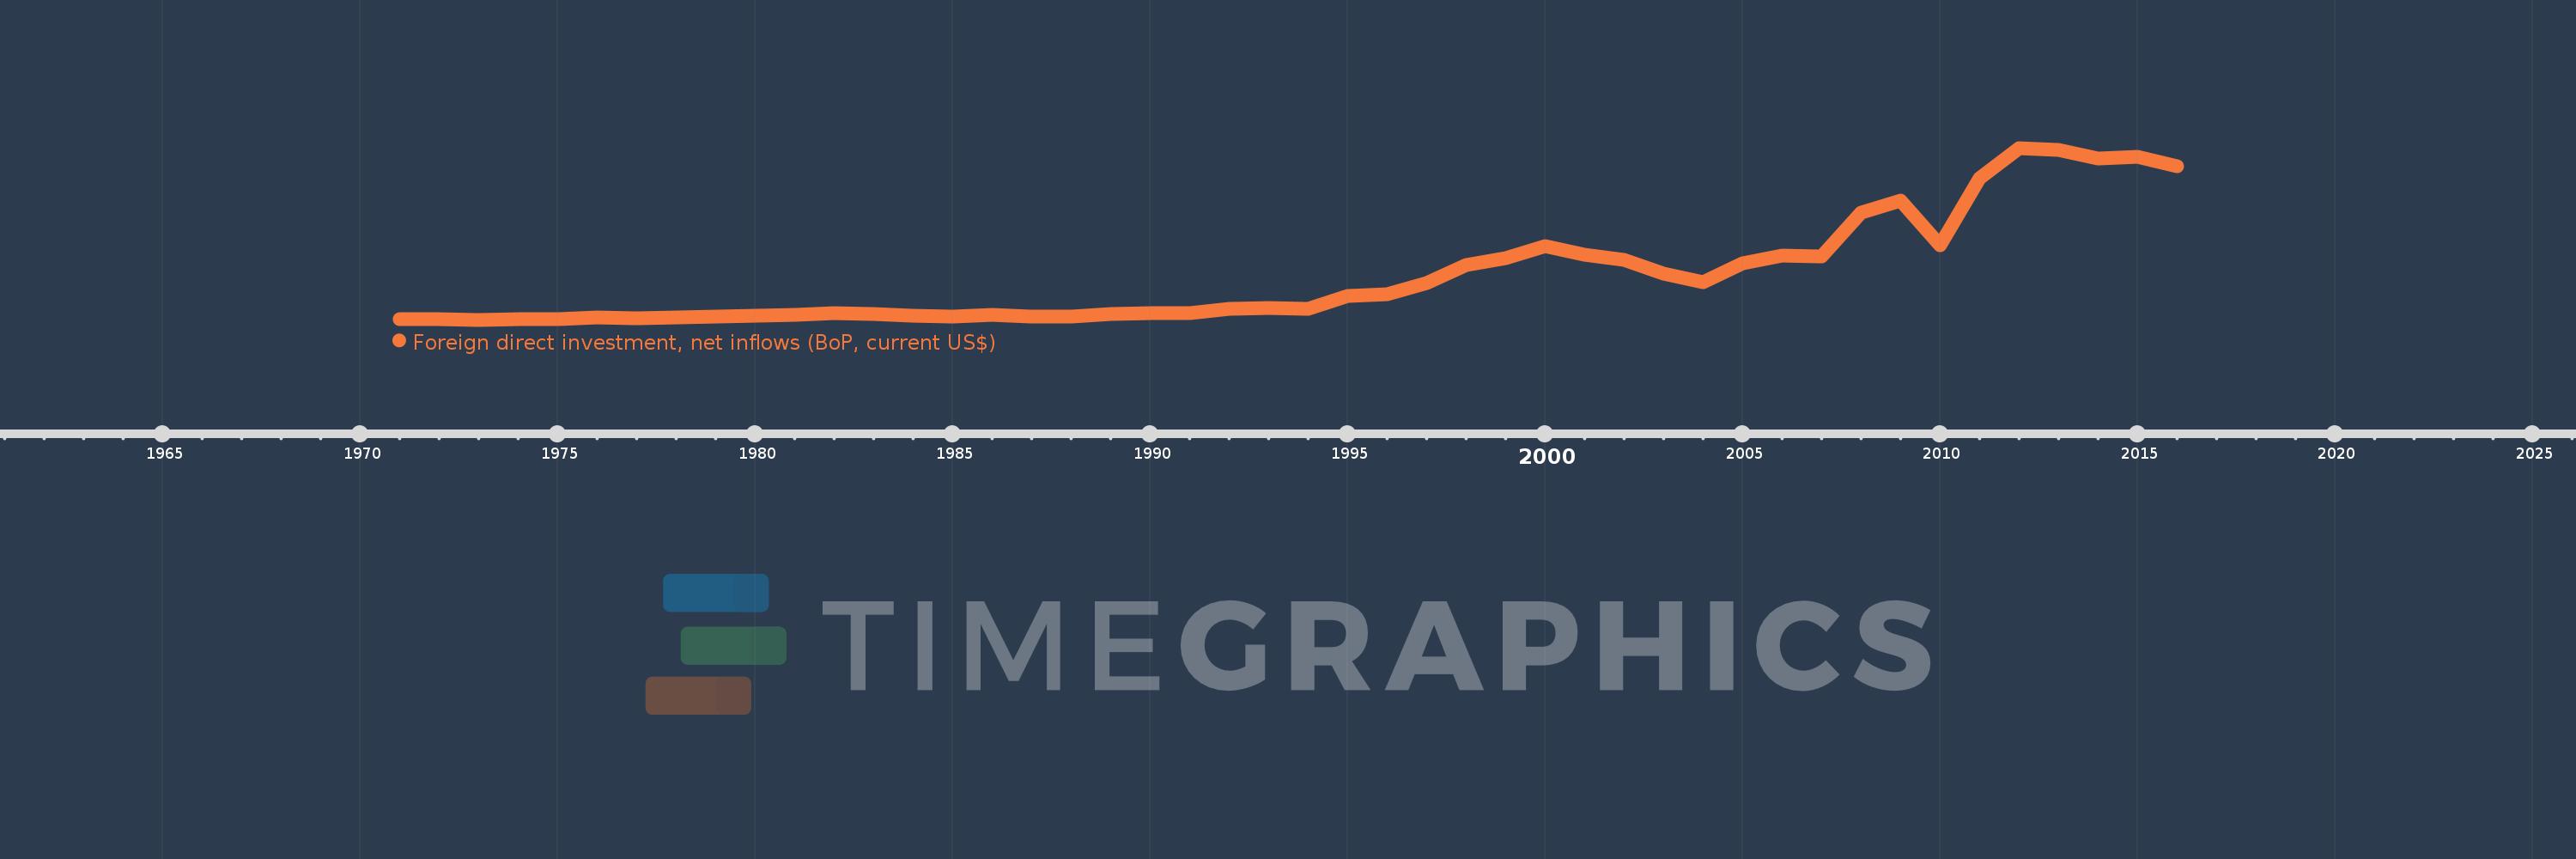
Foreign direct investment, net inflows (BoP, current US$)
2016,2015,2014,2013,2012,2011,2010,2009,2008,2007,2006,2005,2004,2003,2002,2001,2000,1999,1998,1997,1996,1995,1994,1993,1992,1991,1990,1989,1988,1987,1986,1985,1984,1983,1982,1981,1980,1979,1978,1977,1976,1975,1974,1973,1972,1971
This statistics in other country:
AfghanistanAlbaniaAlgeriaAngolaAntigua and BarbudaArab WorldArgentinaArmeniaArubaAustraliaAustriaAzerbaijanBahamas, TheBahrainBangladeshBarbadosBelarusBelgiumBelizeBeninBermudaBhutanBoliviaBosnia and HerzegovinaBotswanaBrazilBritish Virgin IslandsBrunei DarussalamBulgariaBurkina FasoBurundiCabo VerdeCambodiaCameroonCanadaCaribbean small statesCayman IslandsCentral African RepublicCentral Europe and the BalticsChadChileChinaColombiaComorosCongo, Dem. Rep.Congo, Rep.Costa RicaCote d'IvoireCroatiaCuracaoCyprusCzech RepublicDenmarkDjiboutiDominicaDominican RepublicEarly-demographic dividendEast Asia & PacificEast Asia & Pacific (excluding high income)East Asia & Pacific (IDA & IBRD countries)EcuadorEgypt, Arab Rep.El SalvadorEquatorial GuineaEritreaEstoniaEthiopiaEuro areaEurope & Central AsiaEurope & Central Asia (excluding high income)Europe & Central Asia (IDA & IBRD countries)European UnionFijiFinlandFragile and conflict affected situationsFranceFrench PolynesiaGabonGambia, TheGeorgiaGermanyGhanaGibraltarGreeceGrenadaGuatemalaGuineaGuinea-BissauGuyanaHaitiHeavily indebted poor countries (HIPC)High incomeHondurasHong Kong SAR, ChinaHungaryIBRD onlyIcelandIDA & IBRD totalIDA blendIDA onlyIDA totalIndiaIndonesiaIran, Islamic Rep.IraqIrelandIsraelItalyJamaicaJapanJordanKazakhstanKenyaKiribatiKorea, Dem. People’s Rep.Korea, Rep.KosovoKuwaitKyrgyz RepublicLao PDRLate-demographic dividendLatin America & Caribbean Latin America & Caribbean (excluding high income)Latin America & the Caribbean (IDA & IBRD countries)LatviaLeast developed countries: UN classificationLebanonLesothoLiberiaLibyaLithuaniaLow & middle incomeLow incomeLower middle incomeLuxembourgMacao SAR, ChinaMacedonia, FYRMadagascarMalawiMalaysiaMaldivesMaliMaltaMarshall IslandsMauritaniaMauritiusMexicoMicronesia, Fed. Sts.Middle East & North AfricaMiddle East & North Africa (excluding high income)Middle East & North Africa (IDA & IBRD countries)Middle incomeMoldovaMongoliaMontenegroMoroccoMozambiqueMyanmarNamibiaNauruNepalNetherlandsNew CaledoniaNew ZealandNicaraguaNigerNigeriaNorth AmericaNorthern Mariana IslandsNorwayOECD membersOmanOther small statesPacific island small statesPakistanPalauPanamaPapua New GuineaParaguayPeruPhilippinesPolandPortugalPost-demographic dividendPre-demographic dividendQatarRomaniaRussian FederationRwandaSamoaSao Tome and PrincipeSaudi ArabiaSenegalSerbiaSeychellesSierra LeoneSingaporeSint Maarten (Dutch part)Slovak RepublicSloveniaSmall statesSolomon IslandsSomaliaSouth AfricaSouth AsiaSouth Asia (IDA & IBRD)South SudanSpainSri LankaSt. Kitts and NevisSt. LuciaSt. Vincent and the GrenadinesSub-Saharan Africa Sub-Saharan Africa (excluding high income)Sub-Saharan Africa (IDA & IBRD countries)SudanSurinameSwazilandSwedenSwitzerlandSyrian Arab RepublicTajikistanTanzaniaThailandTimor-LesteTogoTongaTrinidad and TobagoTunisiaTurkeyTurkmenistanTuvaluUgandaUkraineUnited Arab EmiratesUnited KingdomUnited StatesUpper middle incomeUruguayUzbekistanVanuatuVenezuela, RBVietnamWest Bank and GazaWorldYemen, Rep.ZambiaZimbabwe Timeline:
This timeline shows a graph from 1971 to 2016 of Latin America & the Caribbean (IDA & IBRD countries). No data until 1970. Number of actual observations by date: 46.
Source name:
World Development Indicators
Source organization:
International Monetary Fund, Balance of Payments database, supplemented by data from the United Nations Conference on Trade and Development and official national sources.
Categories, topics:
Economy & Growth, Financial Sector, External Debt
Last updated:
apr 23, 2017
Indicators value changes by year
Minimum:
118.091 mln
jan 1, 1973
Maximum:
207.778 bln
jan 1, 2012
At the date of observation
Value
Absolute change
Change from previous value
jan 1, 1971
606.453 mln
+606.453 mln
0.0%
jan 1, 1972
873.288 mln
+266.835 mln
44.0%
jan 1, 1973
118.091 mln
-755.197 mln
-86.48%
jan 1, 1974
742.393 mln
+624.302 mln
528.66%
jan 1, 1975
469.54 mln
-272.853 mln
-36.75%
jan 1, 1976
2.689 bln
+2.22 bln
472.77%
jan 1, 1977
1.97 bln
-719.697 mln
-26.76%
jan 1, 1978
2.915 bln
+945.126 mln
47.98%
jan 1, 1979
3.907 bln
+992.627 mln
34.05%
jan 1, 1980
5.219 bln
+1.312 bln
33.57%
jan 1, 1981
6.408 bln
+1.189 bln
22.79%
jan 1, 1982
8.631 bln
+2.223 bln
34.69%
jan 1, 1983
6.971 bln
-1.66 bln
-19.23%
jan 1, 1984
5.446 bln
-1.526 bln
-21.88%
jan 1, 1985
4.222 bln
-1.224 bln
-22.47%
jan 1, 1986
6.003 bln
+1.78 bln
42.16%
jan 1, 1987
4.36 bln
-1.643 bln
-27.37%
jan 1, 1988
3.741 bln
-618.298 mln
-14.18%
jan 1, 1989
7.481 bln
+3.74 bln
99.95%
jan 1, 1990
7.75 bln
+268.886 mln
3.59%
jan 1, 1991
8.215 bln
+464.816 mln
6.0%
jan 1, 1992
12.963 bln
+4.749 bln
57.81%
jan 1, 1993
14.778 bln
+1.814 bln
14.0%
jan 1, 1994
13.819 bln
-959.301 mln
-6.49%
jan 1, 1995
28.76 bln
+14.941 bln
108.12%
jan 1, 1996
30.511 bln
+1.752 bln
6.09%
jan 1, 1997
44.185 bln
+13.673 bln
44.81%
jan 1, 1998
66.727 bln
+22.542 bln
51.02%
jan 1, 1999
74.444 bln
+7.717 bln
11.56%
jan 1, 2000
88.734 bln
+14.29 bln
19.2%
jan 1, 2001
79.194 bln
-9.54 bln
-10.75%
jan 1, 2002
72.497 bln
-6.697 bln
-8.46%
jan 1, 2003
55.65 bln
-16.848 bln
-23.24%
jan 1, 2004
45.309 bln
-10.34 bln
-18.58%
jan 1, 2005
68.515 bln
+23.206 bln
51.22%
jan 1, 2006
77.368 bln
+8.853 bln
12.92%
jan 1, 2007
76.694 bln
-674.077 mln
-0.87%
jan 1, 2008
129.719 bln
+53.025 bln
69.14%
jan 1, 2009
144.338 bln
+14.619 bln
11.27%
jan 1, 2010
89.999 bln
-54.34 bln
-37.65%
jan 1, 2011
171.163 bln
+81.164 bln
90.18%
jan 1, 2012
207.778 bln
+36.616 bln
21.39%
jan 1, 2013
204.992 bln
-2.786 bln
-1.34%
jan 1, 2014
194.795 bln
-10.198 bln
-4.97%
jan 1, 2015
197.53 bln
+2.735 bln
1.4%
jan 1, 2016
185.152 bln
-12.378 bln
-6.27%
Ranking of countries by current statistics by years


Comments: