29
/
en
AIzaSyAYiBZKx7MnpbEhh9jyipgxe19OcubqV5w
April 1, 2024
245570
South Africa
ZAF
true
2
1
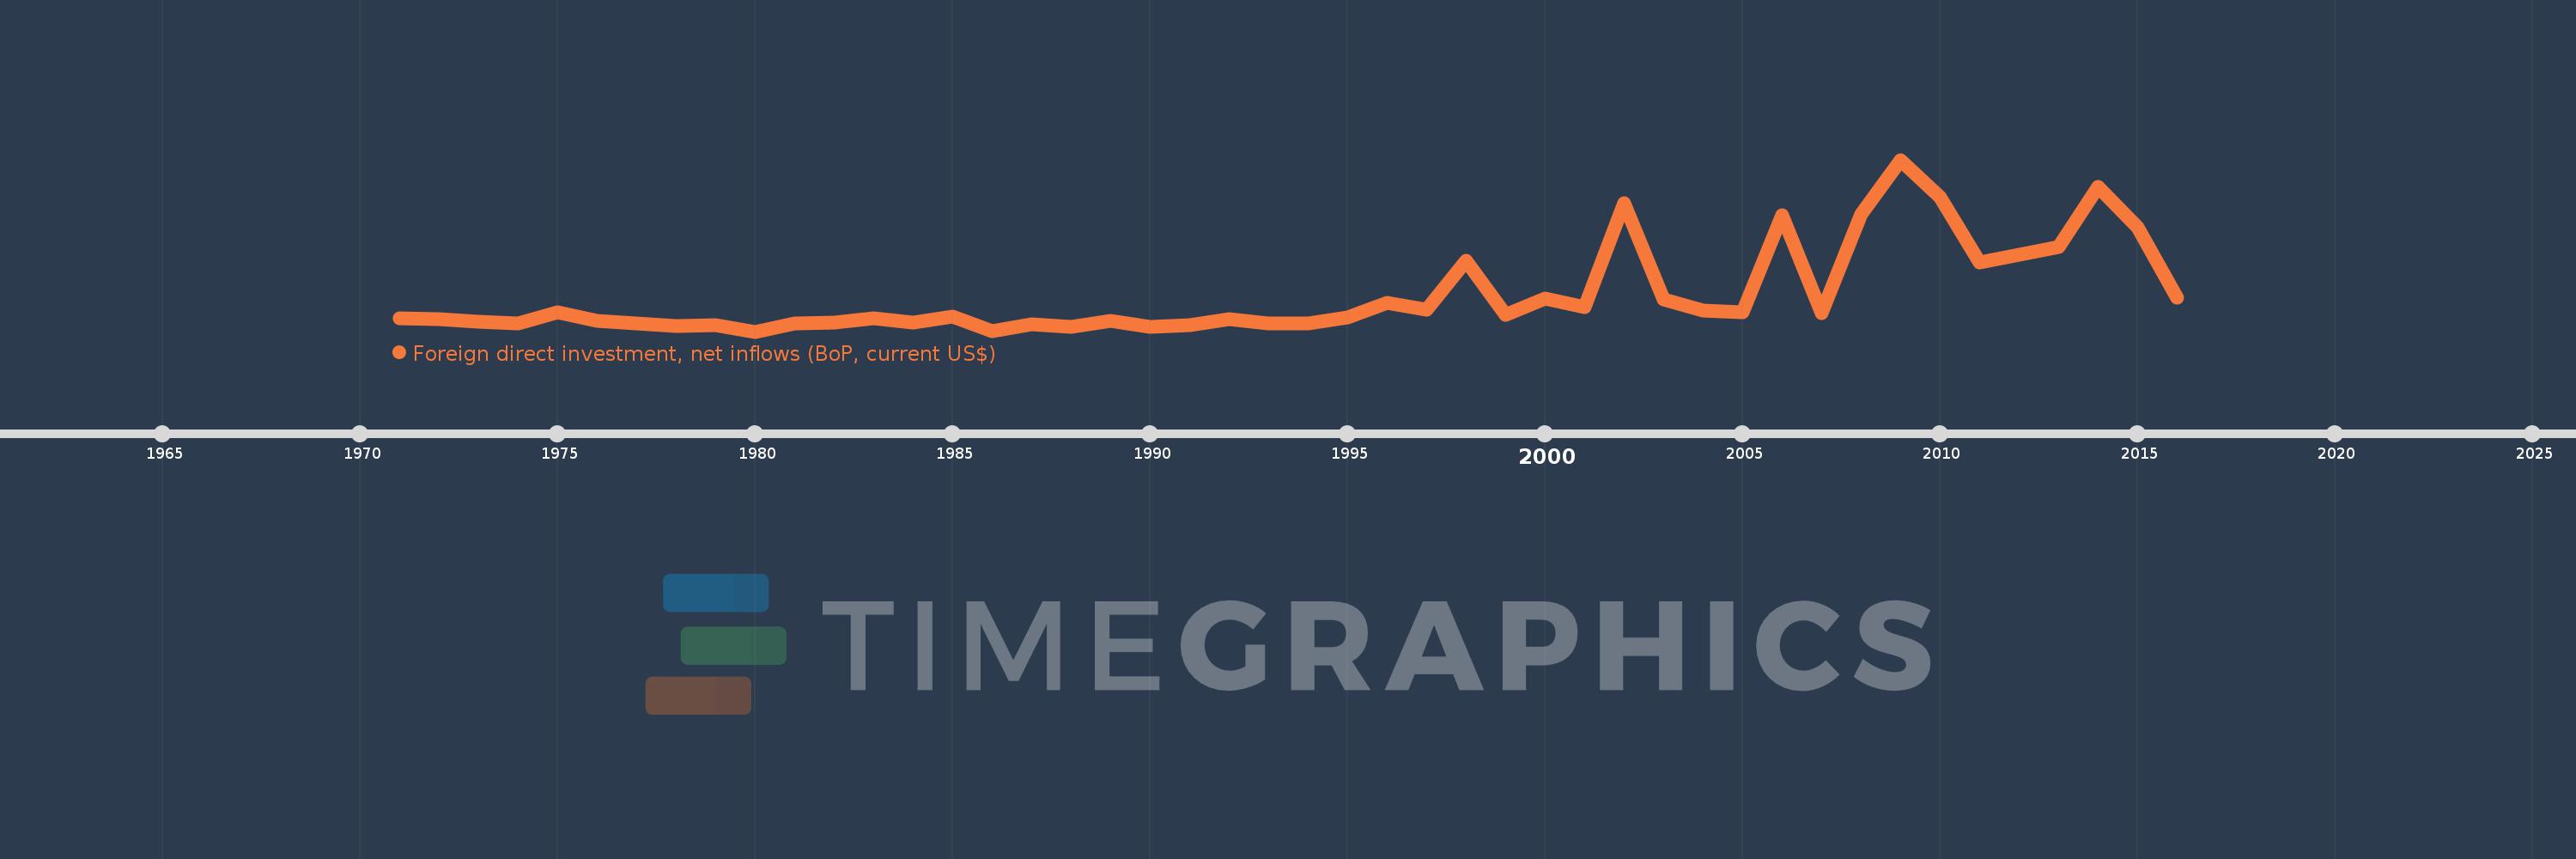
Foreign direct investment, net inflows (BoP, current US$)
2016,2015,2014,2013,2012,2011,2010,2009,2008,2007,2006,2005,2004,2003,2002,2001,2000,1999,1998,1997,1996,1995,1994,1993,1992,1991,1990,1989,1988,1987,1986,1985,1984,1983,1982,1981,1980,1979,1978,1977,1976,1975,1974,1973,1972,1971
This statistics in other country:
AfghanistanAlbaniaAlgeriaAngolaAntigua and BarbudaArab WorldArgentinaArmeniaArubaAustraliaAustriaAzerbaijanBahamas, TheBahrainBangladeshBarbadosBelarusBelgiumBelizeBeninBermudaBhutanBoliviaBosnia and HerzegovinaBotswanaBrazilBritish Virgin IslandsBrunei DarussalamBulgariaBurkina FasoBurundiCabo VerdeCambodiaCameroonCanadaCaribbean small statesCayman IslandsCentral African RepublicCentral Europe and the BalticsChadChileChinaColombiaComorosCongo, Dem. Rep.Congo, Rep.Costa RicaCote d'IvoireCroatiaCuracaoCyprusCzech RepublicDenmarkDjiboutiDominicaDominican RepublicEarly-demographic dividendEast Asia & PacificEast Asia & Pacific (excluding high income)East Asia & Pacific (IDA & IBRD countries)EcuadorEgypt, Arab Rep.El SalvadorEquatorial GuineaEritreaEstoniaEthiopiaEuro areaEurope & Central AsiaEurope & Central Asia (excluding high income)Europe & Central Asia (IDA & IBRD countries)European UnionFijiFinlandFragile and conflict affected situationsFranceFrench PolynesiaGabonGambia, TheGeorgiaGermanyGhanaGibraltarGreeceGrenadaGuatemalaGuineaGuinea-BissauGuyanaHaitiHeavily indebted poor countries (HIPC)High incomeHondurasHong Kong SAR, ChinaHungaryIBRD onlyIcelandIDA & IBRD totalIDA blendIDA onlyIDA totalIndiaIndonesiaIran, Islamic Rep.IraqIrelandIsraelItalyJamaicaJapanJordanKazakhstanKenyaKiribatiKorea, Dem. People’s Rep.Korea, Rep.KosovoKuwaitKyrgyz RepublicLao PDRLate-demographic dividendLatin America & Caribbean Latin America & Caribbean (excluding high income)Latin America & the Caribbean (IDA & IBRD countries)LatviaLeast developed countries: UN classificationLebanonLesothoLiberiaLibyaLithuaniaLow & middle incomeLow incomeLower middle incomeLuxembourgMacao SAR, ChinaMacedonia, FYRMadagascarMalawiMalaysiaMaldivesMaliMaltaMarshall IslandsMauritaniaMauritiusMexicoMicronesia, Fed. Sts.Middle East & North AfricaMiddle East & North Africa (excluding high income)Middle East & North Africa (IDA & IBRD countries)Middle incomeMoldovaMongoliaMontenegroMoroccoMozambiqueMyanmarNamibiaNauruNepalNetherlandsNew CaledoniaNew ZealandNicaraguaNigerNigeriaNorth AmericaNorthern Mariana IslandsNorwayOECD membersOmanOther small statesPacific island small statesPakistanPalauPanamaPapua New GuineaParaguayPeruPhilippinesPolandPortugalPost-demographic dividendPre-demographic dividendQatarRomaniaRussian FederationRwandaSamoaSao Tome and PrincipeSaudi ArabiaSenegalSerbiaSeychellesSierra LeoneSingaporeSint Maarten (Dutch part)Slovak RepublicSloveniaSmall statesSolomon IslandsSomaliaSouth AfricaSouth AsiaSouth Asia (IDA & IBRD)South SudanSpainSri LankaSt. Kitts and NevisSt. LuciaSt. Vincent and the GrenadinesSub-Saharan Africa Sub-Saharan Africa (excluding high income)Sub-Saharan Africa (IDA & IBRD countries)SudanSurinameSwazilandSwedenSwitzerlandSyrian Arab RepublicTajikistanTanzaniaThailandTimor-LesteTogoTongaTrinidad and TobagoTunisiaTurkeyTurkmenistanTuvaluUgandaUkraineUnited Arab EmiratesUnited KingdomUnited StatesUpper middle incomeUruguayUzbekistanVanuatuVenezuela, RBVietnamWest Bank and GazaWorldYemen, Rep.ZambiaZimbabwe Timeline:
This timeline shows a graph from 1971 to 2016 of South Africa. No data until 1970. Number of actual observations by date: 46.
Source name:
World Development Indicators
Source organization:
International Monetary Fund, Balance of Payments database, supplemented by data from the United Nations Conference on Trade and Development and official national sources.
Categories, topics:
Economy & Growth, Financial Sector, External Debt
Last updated:
apr 23, 2017
Indicators value changes by year
Minimum:
-484.547 mln
jan 1, 1980
Maximum:
9.885 bln
jan 1, 2009
At the date of observation
Value
Absolute change
Change from previous value
jan 1, 1971
333.606 mln
+333.606 mln
0.0%
jan 1, 1972
260.062 mln
-73.544 mln
-22.05%
jan 1, 1973
114.416 mln
-145.646 mln
-56.0%
jan 1, 1974
27.373 mln
-87.043 mln
-76.08%
jan 1, 1975
696.124 mln
+668.751 mln
2.44K%
jan 1, 1976
187.963 mln
-508.161 mln
-73.0%
jan 1, 1977
18.4 mln
-169.563 mln
-90.21%
jan 1, 1978
-121.9 mln
-140.3 mln
-762.5%
jan 1, 1979
-109.25 mln
+12.65 mln
-10.38%
jan 1, 1980
-484.547 mln
-375.297 mln
343.52%
jan 1, 1981
-10.3 mln
+474.247 mln
-97.87%
jan 1, 1982
65.0 mln
+75.3 mln
-731.07%
jan 1, 1983
329.7 mln
+264.7 mln
407.23%
jan 1, 1984
70.9 mln
-258.8 mln
-78.5%
jan 1, 1985
419.5 mln
+348.6 mln
491.68%
jan 1, 1986
-452.644 mln
-872.144 mln
-207.9%
jan 1, 1987
-50.487 mln
+402.157 mln
-88.85%
jan 1, 1988
-191.668 mln
-141.181 mln
279.64%
jan 1, 1989
158.437 mln
+350.105 mln
-182.66%
jan 1, 1990
-201.208 mln
-359.646 mln
-227.0%
jan 1, 1991
-75.722 mln
+125.486 mln
-62.37%
jan 1, 1992
254.134 mln
+329.856 mln
-435.61%
jan 1, 1993
3.358 mln
-250.776 mln
-98.68%
jan 1, 1994
11.291 mln
+7.933 mln
236.23%
jan 1, 1995
374.41 mln
+363.12 mln
3.22K%
jan 1, 1996
1.248 bln
+874.014 mln
233.44%
jan 1, 1997
816.389 mln
-432.036 mln
-34.61%
jan 1, 1998
3.811 bln
+2.994 bln
366.76%
jan 1, 1999
550.339 mln
-3.26 bln
-85.56%
jan 1, 2000
1.503 bln
+952.994 mln
173.17%
jan 1, 2001
968.831 mln
-534.501 mln
-35.55%
jan 1, 2002
7.27 bln
+6.302 bln
650.42%
jan 1, 2003
1.48 bln
-5.791 bln
-79.65%
jan 1, 2004
783.136 mln
-696.668 mln
-47.08%
jan 1, 2005
701.422 mln
-81.714 mln
-10.43%
jan 1, 2006
6.522 bln
+5.821 bln
829.84%
jan 1, 2007
623.292 mln
-5.899 bln
-90.44%
jan 1, 2008
6.587 bln
+5.964 bln
956.78%
jan 1, 2009
9.885 bln
+3.298 bln
50.07%
jan 1, 2010
7.624 bln
-2.261 bln
-22.87%
jan 1, 2011
3.693 bln
-3.931 bln
-51.56%
jan 1, 2012
4.139 bln
+446.017 mln
12.08%
jan 1, 2013
4.626 bln
+486.74 mln
11.76%
jan 1, 2014
8.233 bln
+3.606 bln
77.96%
jan 1, 2015
5.792 bln
-2.441 bln
-29.65%
jan 1, 2016
1.575 bln
-4.216 bln
-72.8%
Ranking of countries by current statistics by years


Comments: