29
/
en
AIzaSyAYiBZKx7MnpbEhh9jyipgxe19OcubqV5w
April 1, 2024
239273
Sierra Leone
SLE
true
2
1
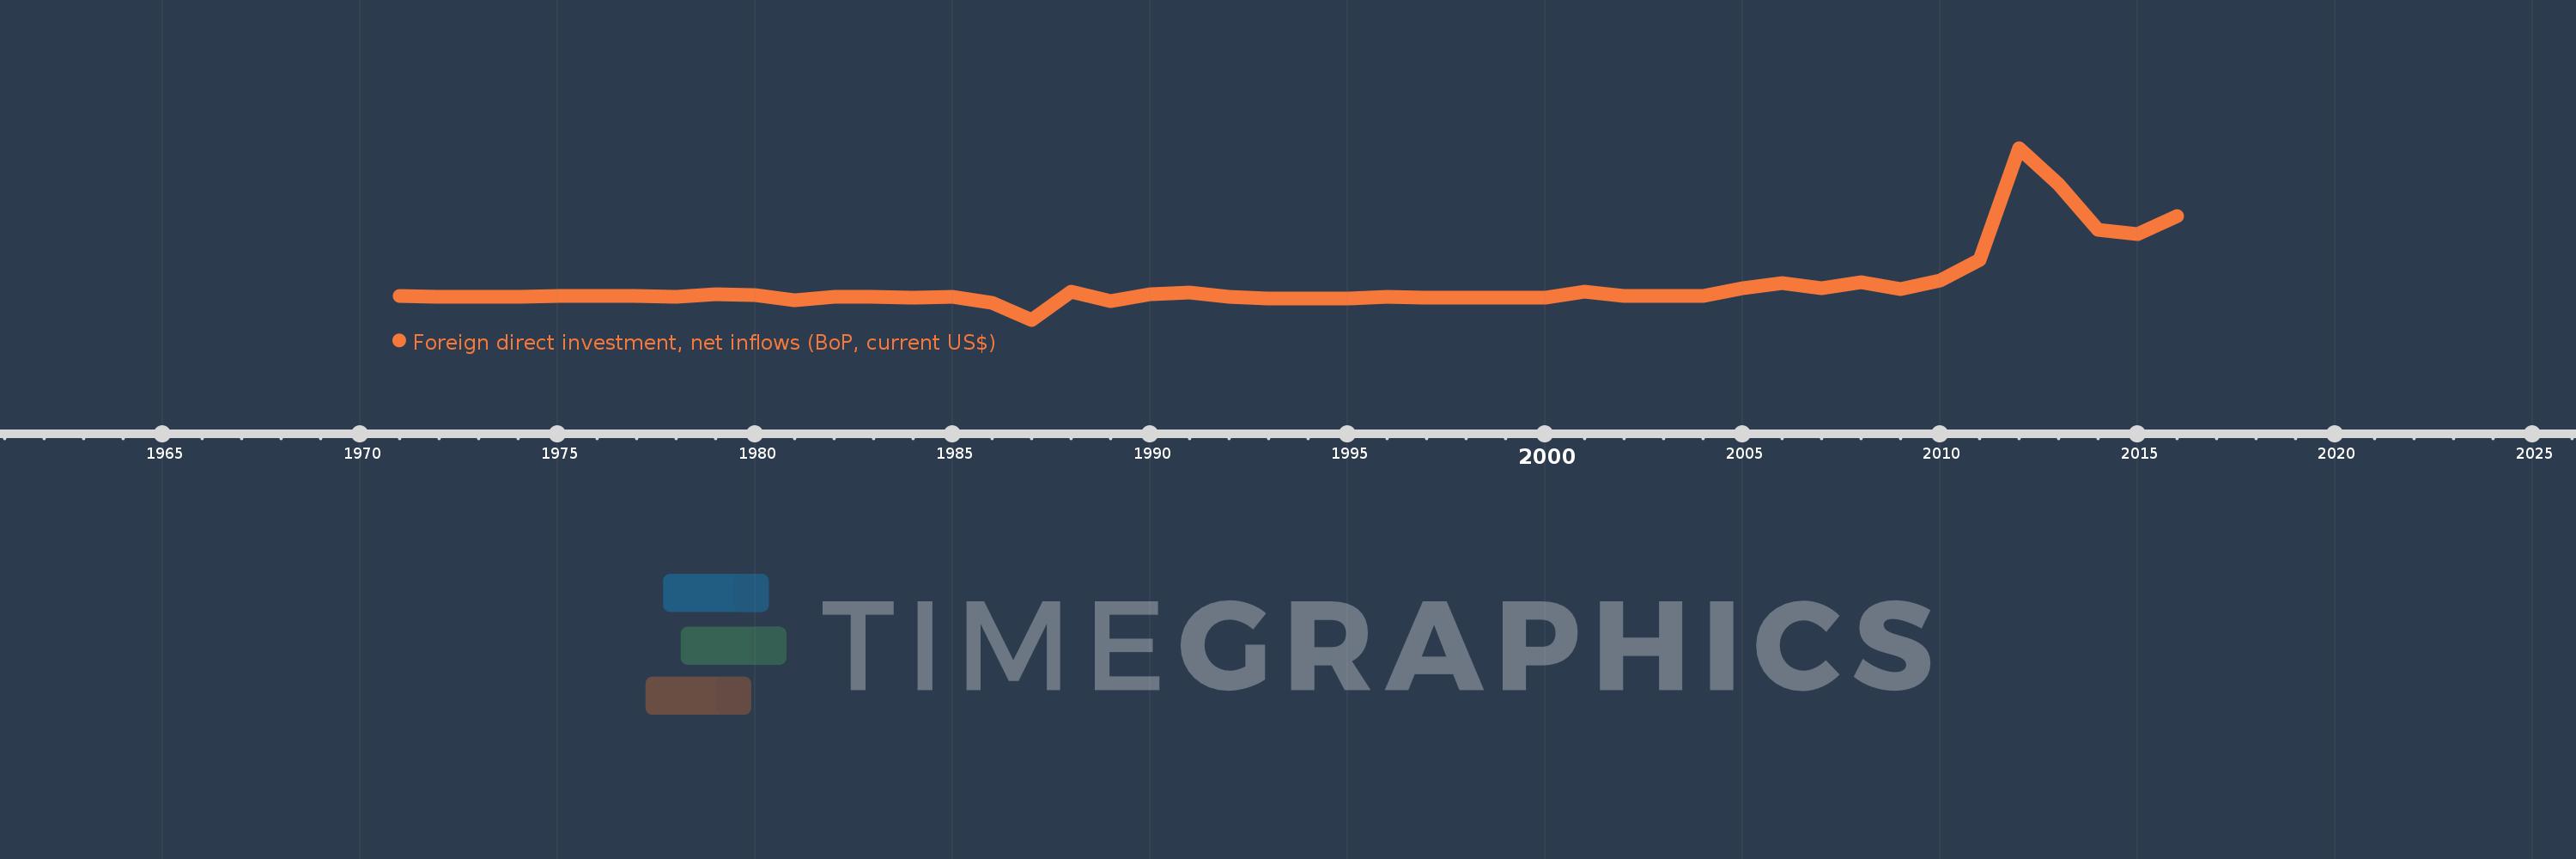
Foreign direct investment, net inflows (BoP, current US$)
2016,2015,2014,2013,2012,2011,2010,2009,2008,2007,2006,2005,2004,2003,2002,2001,2000,1999,1998,1997,1996,1995,1994,1993,1992,1991,1990,1989,1988,1987,1986,1985,1984,1983,1982,1981,1980,1979,1978,1977,1976,1975,1974,1973,1972,1971
This statistics in other country:
AfghanistanAlbaniaAlgeriaAngolaAntigua and BarbudaArab WorldArgentinaArmeniaArubaAustraliaAustriaAzerbaijanBahamas, TheBahrainBangladeshBarbadosBelarusBelgiumBelizeBeninBermudaBhutanBoliviaBosnia and HerzegovinaBotswanaBrazilBritish Virgin IslandsBrunei DarussalamBulgariaBurkina FasoBurundiCabo VerdeCambodiaCameroonCanadaCaribbean small statesCayman IslandsCentral African RepublicCentral Europe and the BalticsChadChileChinaColombiaComorosCongo, Dem. Rep.Congo, Rep.Costa RicaCote d'IvoireCroatiaCuracaoCyprusCzech RepublicDenmarkDjiboutiDominicaDominican RepublicEarly-demographic dividendEast Asia & PacificEast Asia & Pacific (excluding high income)East Asia & Pacific (IDA & IBRD countries)EcuadorEgypt, Arab Rep.El SalvadorEquatorial GuineaEritreaEstoniaEthiopiaEuro areaEurope & Central AsiaEurope & Central Asia (excluding high income)Europe & Central Asia (IDA & IBRD countries)European UnionFijiFinlandFragile and conflict affected situationsFranceFrench PolynesiaGabonGambia, TheGeorgiaGermanyGhanaGibraltarGreeceGrenadaGuatemalaGuineaGuinea-BissauGuyanaHaitiHeavily indebted poor countries (HIPC)High incomeHondurasHong Kong SAR, ChinaHungaryIBRD onlyIcelandIDA & IBRD totalIDA blendIDA onlyIDA totalIndiaIndonesiaIran, Islamic Rep.IraqIrelandIsraelItalyJamaicaJapanJordanKazakhstanKenyaKiribatiKorea, Dem. People’s Rep.Korea, Rep.KosovoKuwaitKyrgyz RepublicLao PDRLate-demographic dividendLatin America & Caribbean Latin America & Caribbean (excluding high income)Latin America & the Caribbean (IDA & IBRD countries)LatviaLeast developed countries: UN classificationLebanonLesothoLiberiaLibyaLithuaniaLow & middle incomeLow incomeLower middle incomeLuxembourgMacao SAR, ChinaMacedonia, FYRMadagascarMalawiMalaysiaMaldivesMaliMaltaMarshall IslandsMauritaniaMauritiusMexicoMicronesia, Fed. Sts.Middle East & North AfricaMiddle East & North Africa (excluding high income)Middle East & North Africa (IDA & IBRD countries)Middle incomeMoldovaMongoliaMontenegroMoroccoMozambiqueMyanmarNamibiaNauruNepalNetherlandsNew CaledoniaNew ZealandNicaraguaNigerNigeriaNorth AmericaNorthern Mariana IslandsNorwayOECD membersOmanOther small statesPacific island small statesPakistanPalauPanamaPapua New GuineaParaguayPeruPhilippinesPolandPortugalPost-demographic dividendPre-demographic dividendQatarRomaniaRussian FederationRwandaSamoaSao Tome and PrincipeSaudi ArabiaSenegalSerbiaSeychellesSierra LeoneSingaporeSint Maarten (Dutch part)Slovak RepublicSloveniaSmall statesSolomon IslandsSomaliaSouth AfricaSouth AsiaSouth Asia (IDA & IBRD)South SudanSpainSri LankaSt. Kitts and NevisSt. LuciaSt. Vincent and the GrenadinesSub-Saharan Africa Sub-Saharan Africa (excluding high income)Sub-Saharan Africa (IDA & IBRD countries)SudanSurinameSwazilandSwedenSwitzerlandSyrian Arab RepublicTajikistanTanzaniaThailandTimor-LesteTogoTongaTrinidad and TobagoTunisiaTurkeyTurkmenistanTuvaluUgandaUkraineUnited Arab EmiratesUnited KingdomUnited StatesUpper middle incomeUruguayUzbekistanVanuatuVenezuela, RBVietnamWest Bank and GazaWorldYemen, Rep.ZambiaZimbabwe Timeline:
This timeline shows a graph from 1971 to 2016 of Sierra Leone. No data until 1970. Number of actual observations by date: 46.
Source name:
World Development Indicators
Source organization:
International Monetary Fund, Balance of Payments database, supplemented by data from the United Nations Conference on Trade and Development and official national sources.
Categories, topics:
Economy & Growth, Financial Sector, External Debt
Last updated:
apr 23, 2017
Indicators value changes by year
Minimum:
-140.311 mln
jan 1, 1987
Maximum:
950.478 mln
jan 1, 2012
At the date of observation
Value
Absolute change
Change from previous value
jan 1, 1971
8.2 mln
+8.2 mln
0.0%
jan 1, 1972
5.2 mln
-3.0 mln
-36.59%
jan 1, 1973
3.8 mln
-1.4 mln
-26.92%
jan 1, 1974
6.24 mln
+2.44 mln
64.21%
jan 1, 1975
10.5 mln
+4.26 mln
68.27%
jan 1, 1976
10.1 mln
-400.0K
-3.81%
jan 1, 1977
8.5 mln
-1.6 mln
-15.84%
jan 1, 1978
5.059 mln
-3.441 mln
-40.48%
jan 1, 1979
24.259 mln
+19.2 mln
379.53%
jan 1, 1980
16.084 mln
-8.175 mln
-33.7%
jan 1, 1981
-18.67 mln
-34.754 mln
-216.08%
jan 1, 1982
7.506 mln
+26.176 mln
-140.2%
jan 1, 1983
4.683 mln
-2.823 mln
-37.61%
jan 1, 1984
1.697 mln
-2.985 mln
-63.75%
jan 1, 1985
5.857 mln
+4.159 mln
245.06%
jan 1, 1986
-30.957 mln
-36.814 mln
-628.58%
jan 1, 1987
-140.311 mln
-109.354 mln
353.24%
jan 1, 1988
39.41 mln
+179.72 mln
-128.09%
jan 1, 1989
-23.088 mln
-62.498 mln
-158.59%
jan 1, 1990
22.356 mln
+45.445 mln
-196.83%
jan 1, 1991
32.435 mln
+10.078 mln
45.08%
jan 1, 1992
7.504 mln
-24.93 mln
-76.86%
jan 1, 1993
-5.599 mln
-13.104 mln
-174.61%
jan 1, 1994
-7.463 mln
-1.864 mln
33.29%
jan 1, 1995
-2.874 mln
+4.589 mln
-61.49%
jan 1, 1996
7.287 mln
+10.161 mln
-353.53%
jan 1, 1997
663.928K
-6.623 mln
-90.89%
jan 1, 1998
1.8 mln
+1.136 mln
171.12%
jan 1, 1999
104.885K
-1.695 mln
-94.17%
jan 1, 2000
533.202K
+428.317K
408.37%
jan 1, 2001
39.001 mln
+38.468 mln
7.21K%
jan 1, 2002
9.836 mln
-29.165 mln
-74.78%
jan 1, 2003
10.413 mln
+577.667K
5.87%
jan 1, 2004
8.615 mln
-1.798 mln
-17.27%
jan 1, 2005
61.153 mln
+52.538 mln
609.84%
jan 1, 2006
90.732 mln
+29.578 mln
48.37%
jan 1, 2007
58.869 mln
-31.863 mln
-35.12%
jan 1, 2008
95.47 mln
+36.601 mln
62.17%
jan 1, 2009
53.095 mln
-42.375 mln
-44.39%
jan 1, 2010
110.43 mln
+57.335 mln
107.99%
jan 1, 2011
238.404 mln
+127.974 mln
115.89%
jan 1, 2012
950.478 mln
+712.074 mln
298.68%
jan 1, 2013
722.447 mln
-228.03 mln
-23.99%
jan 1, 2014
429.675 mln
-292.772 mln
-40.53%
jan 1, 2015
403.907 mln
-25.768 mln
-6.0%
jan 1, 2016
518.68 mln
+114.773 mln
28.42%
Ranking of countries by current statistics by years


Comments: