29
/
en
AIzaSyAYiBZKx7MnpbEhh9jyipgxe19OcubqV5w
April 1, 2024
191385
Malta
MLT
true
2
1
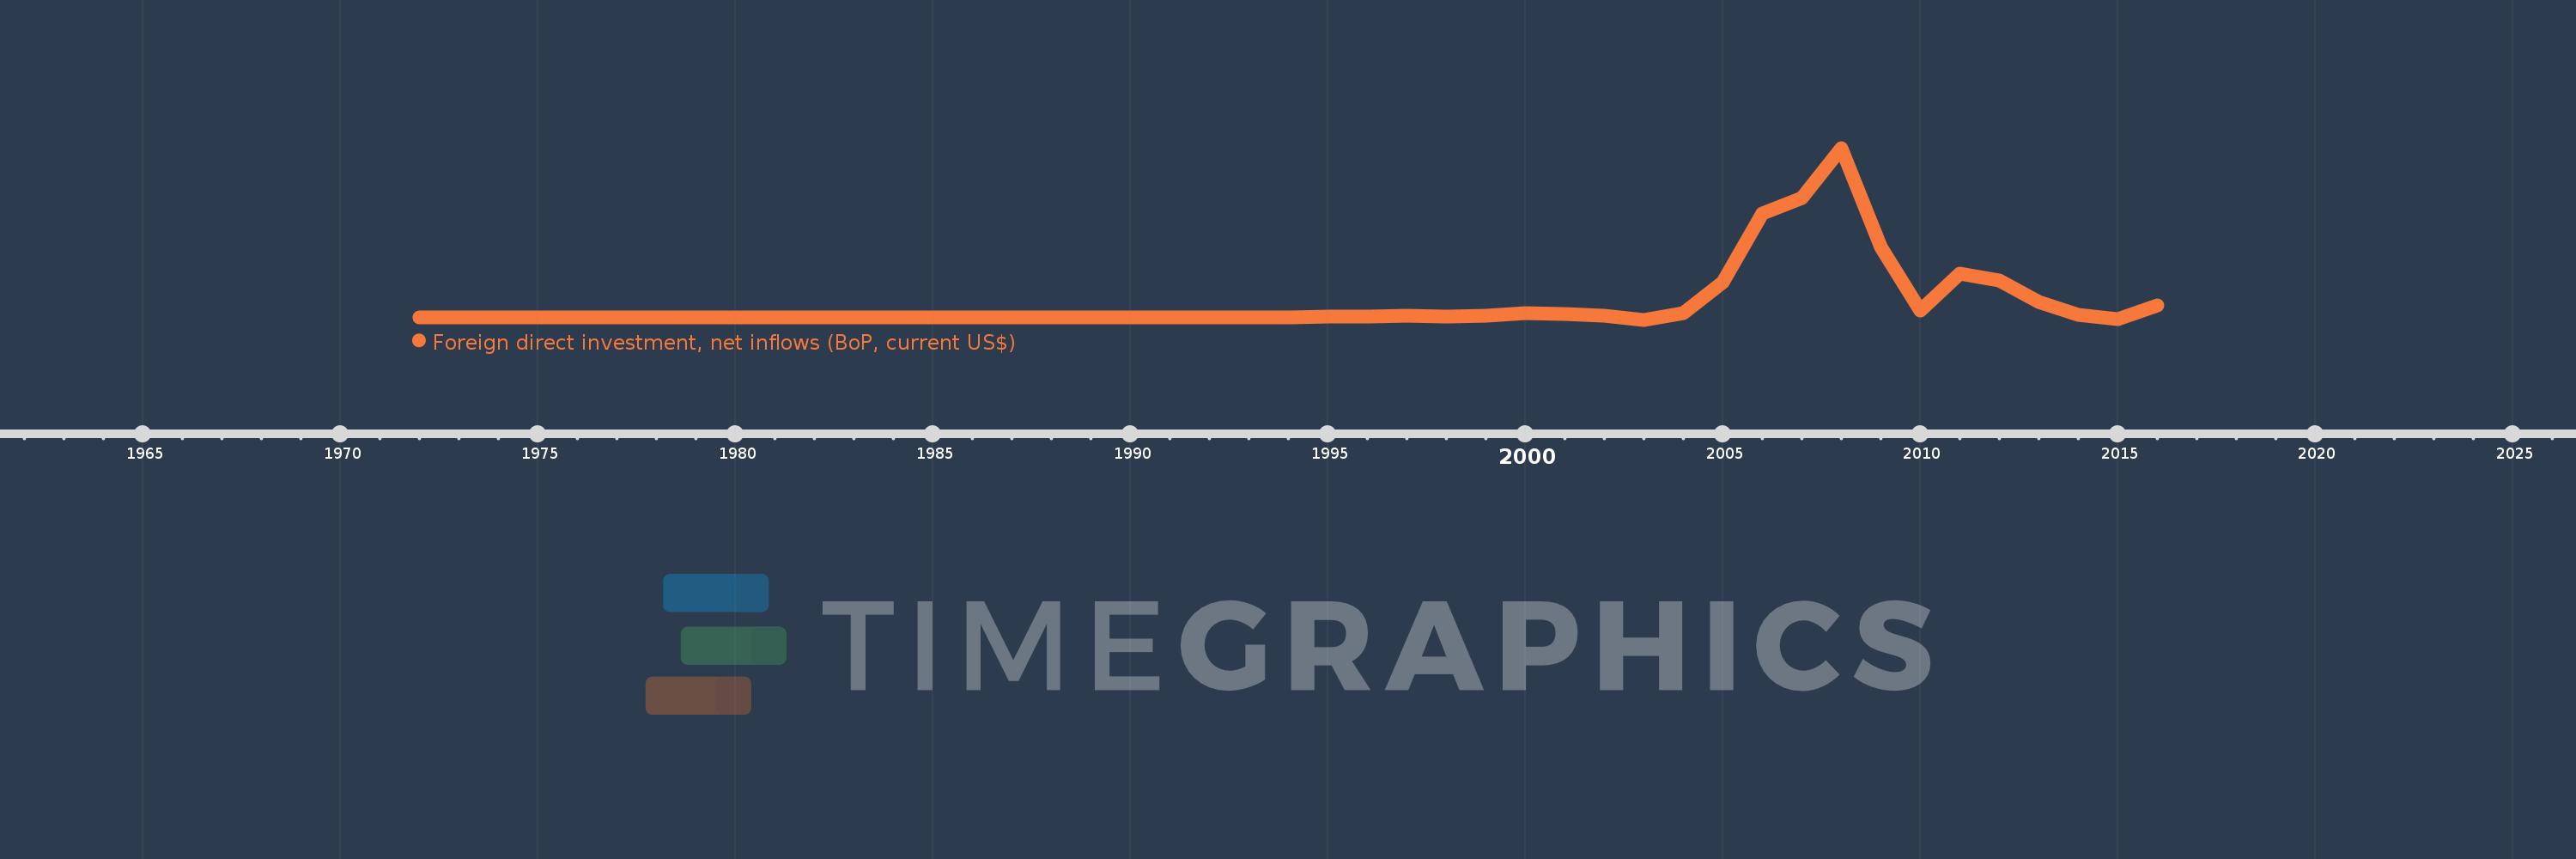
Foreign direct investment, net inflows (BoP, current US$)
2016,2015,2014,2013,2012,2011,2010,2009,2008,2007,2006,2005,2004,2003,2002,2001,2000,1999,1998,1997,1996,1995,1994,1993,1992,1991,1990,1989,1988,1987,1986,1985,1984,1983,1982,1981,1980,1979,1978,1977,1976,1975,1974,1973,1972
This statistics in other country:
AfghanistanAlbaniaAlgeriaAngolaAntigua and BarbudaArab WorldArgentinaArmeniaArubaAustraliaAustriaAzerbaijanBahamas, TheBahrainBangladeshBarbadosBelarusBelgiumBelizeBeninBermudaBhutanBoliviaBosnia and HerzegovinaBotswanaBrazilBritish Virgin IslandsBrunei DarussalamBulgariaBurkina FasoBurundiCabo VerdeCambodiaCameroonCanadaCaribbean small statesCayman IslandsCentral African RepublicCentral Europe and the BalticsChadChileChinaColombiaComorosCongo, Dem. Rep.Congo, Rep.Costa RicaCote d'IvoireCroatiaCuracaoCyprusCzech RepublicDenmarkDjiboutiDominicaDominican RepublicEarly-demographic dividendEast Asia & PacificEast Asia & Pacific (excluding high income)East Asia & Pacific (IDA & IBRD countries)EcuadorEgypt, Arab Rep.El SalvadorEquatorial GuineaEritreaEstoniaEthiopiaEuro areaEurope & Central AsiaEurope & Central Asia (excluding high income)Europe & Central Asia (IDA & IBRD countries)European UnionFijiFinlandFragile and conflict affected situationsFranceFrench PolynesiaGabonGambia, TheGeorgiaGermanyGhanaGibraltarGreeceGrenadaGuatemalaGuineaGuinea-BissauGuyanaHaitiHeavily indebted poor countries (HIPC)High incomeHondurasHong Kong SAR, ChinaHungaryIBRD onlyIcelandIDA & IBRD totalIDA blendIDA onlyIDA totalIndiaIndonesiaIran, Islamic Rep.IraqIrelandIsraelItalyJamaicaJapanJordanKazakhstanKenyaKiribatiKorea, Dem. People’s Rep.Korea, Rep.KosovoKuwaitKyrgyz RepublicLao PDRLate-demographic dividendLatin America & Caribbean Latin America & Caribbean (excluding high income)Latin America & the Caribbean (IDA & IBRD countries)LatviaLeast developed countries: UN classificationLebanonLesothoLiberiaLibyaLithuaniaLow & middle incomeLow incomeLower middle incomeLuxembourgMacao SAR, ChinaMacedonia, FYRMadagascarMalawiMalaysiaMaldivesMaliMaltaMarshall IslandsMauritaniaMauritiusMexicoMicronesia, Fed. Sts.Middle East & North AfricaMiddle East & North Africa (excluding high income)Middle East & North Africa (IDA & IBRD countries)Middle incomeMoldovaMongoliaMontenegroMoroccoMozambiqueMyanmarNamibiaNauruNepalNetherlandsNew CaledoniaNew ZealandNicaraguaNigerNigeriaNorth AmericaNorthern Mariana IslandsNorwayOECD membersOmanOther small statesPacific island small statesPakistanPalauPanamaPapua New GuineaParaguayPeruPhilippinesPolandPortugalPost-demographic dividendPre-demographic dividendQatarRomaniaRussian FederationRwandaSamoaSao Tome and PrincipeSaudi ArabiaSenegalSerbiaSeychellesSierra LeoneSingaporeSint Maarten (Dutch part)Slovak RepublicSloveniaSmall statesSolomon IslandsSomaliaSouth AfricaSouth AsiaSouth Asia (IDA & IBRD)South SudanSpainSri LankaSt. Kitts and NevisSt. LuciaSt. Vincent and the GrenadinesSub-Saharan Africa Sub-Saharan Africa (excluding high income)Sub-Saharan Africa (IDA & IBRD countries)SudanSurinameSwazilandSwedenSwitzerlandSyrian Arab RepublicTajikistanTanzaniaThailandTimor-LesteTogoTongaTrinidad and TobagoTunisiaTurkeyTurkmenistanTuvaluUgandaUkraineUnited Arab EmiratesUnited KingdomUnited StatesUpper middle incomeUruguayUzbekistanVanuatuVenezuela, RBVietnamWest Bank and GazaWorldYemen, Rep.ZambiaZimbabwe Timeline:
This timeline shows a graph from 1972 to 2016 of Malta. No data until 1971. Number of actual observations by date: 45.
Source name:
World Development Indicators
Source organization:
International Monetary Fund, Balance of Payments database, supplemented by data from the United Nations Conference on Trade and Development and official national sources.
Categories, topics:
Economy & Growth, Financial Sector, External Debt
Last updated:
apr 23, 2017
Indicators value changes by year
Minimum:
-497.797 mln
jan 1, 2003
Maximum:
35.597 bln
jan 1, 2008
At the date of observation
Value
Absolute change
Change from previous value
jan 1, 1972
11.545 mln
+11.545 mln
0.0%
jan 1, 1973
4.455 mln
-7.09 mln
-61.41%
jan 1, 1974
5.152 mln
+696.691K
15.64%
jan 1, 1975
10.636 mln
+5.484 mln
106.45%
jan 1, 1976
15.853 mln
+5.217 mln
49.05%
jan 1, 1977
14.113 mln
-1.74 mln
-10.98%
jan 1, 1978
18.47 mln
+4.357 mln
30.87%
jan 1, 1979
21.537 mln
+3.067 mln
16.61%
jan 1, 1980
16.18 mln
-5.357 mln
-24.87%
jan 1, 1981
26.634 mln
+10.454 mln
64.61%
jan 1, 1982
39.048 mln
+12.415 mln
46.61%
jan 1, 1983
20.867 mln
-18.182 mln
-46.56%
jan 1, 1984
24.512 mln
+3.645 mln
17.47%
jan 1, 1985
26.245 mln
+1.734 mln
7.07%
jan 1, 1986
18.97 mln
-7.275 mln
-27.72%
jan 1, 1987
21.883 mln
+2.913 mln
15.36%
jan 1, 1988
19.393 mln
-2.491 mln
-11.38%
jan 1, 1989
40.803 mln
+21.411 mln
110.41%
jan 1, 1990
51.651 mln
+10.848 mln
26.59%
jan 1, 1991
45.794 mln
-5.857 mln
-11.34%
jan 1, 1992
76.982 mln
+31.188 mln
68.1%
jan 1, 1993
39.542 mln
-37.44 mln
-48.63%
jan 1, 1994
56.442 mln
+16.899 mln
42.74%
jan 1, 1995
151.693 mln
+95.252 mln
168.76%
jan 1, 1996
129.193 mln
-22.5 mln
-14.83%
jan 1, 1997
293.183 mln
+163.99 mln
126.93%
jan 1, 1998
82.268 mln
-210.916 mln
-71.94%
jan 1, 1999
283.174 mln
+200.906 mln
244.21%
jan 1, 2000
857.407 mln
+574.233 mln
202.78%
jan 1, 2001
743.185 mln
-114.222 mln
-13.32%
jan 1, 2002
416.889 mln
-326.296 mln
-43.91%
jan 1, 2003
-497.797 mln
-914.686 mln
-219.41%
jan 1, 2004
911.475 mln
+1.409 bln
-283.1%
jan 1, 2005
7.463 bln
+6.552 bln
718.81%
jan 1, 2006
21.813 bln
+14.349 bln
192.27%
jan 1, 2007
25.024 bln
+3.212 bln
14.72%
jan 1, 2008
35.597 bln
+10.573 bln
42.25%
jan 1, 2009
14.837 bln
-20.76 bln
-58.32%
jan 1, 2010
1.444 bln
-13.393 bln
-90.27%
jan 1, 2011
9.247 bln
+7.803 bln
540.3%
jan 1, 2012
7.801 bln
-1.445 bln
-15.63%
jan 1, 2013
3.325 bln
-4.477 bln
-57.38%
jan 1, 2014
564.602 mln
-2.76 bln
-83.02%
jan 1, 2015
-306.773 mln
-871.376 mln
-154.33%
jan 1, 2016
2.519 bln
+2.826 bln
-921.12%
Ranking of countries by current statistics by years


Comments: