29
/
en
AIzaSyAYiBZKx7MnpbEhh9jyipgxe19OcubqV5w
April 1, 2024
256318
Sweden
SWE
true
2
1
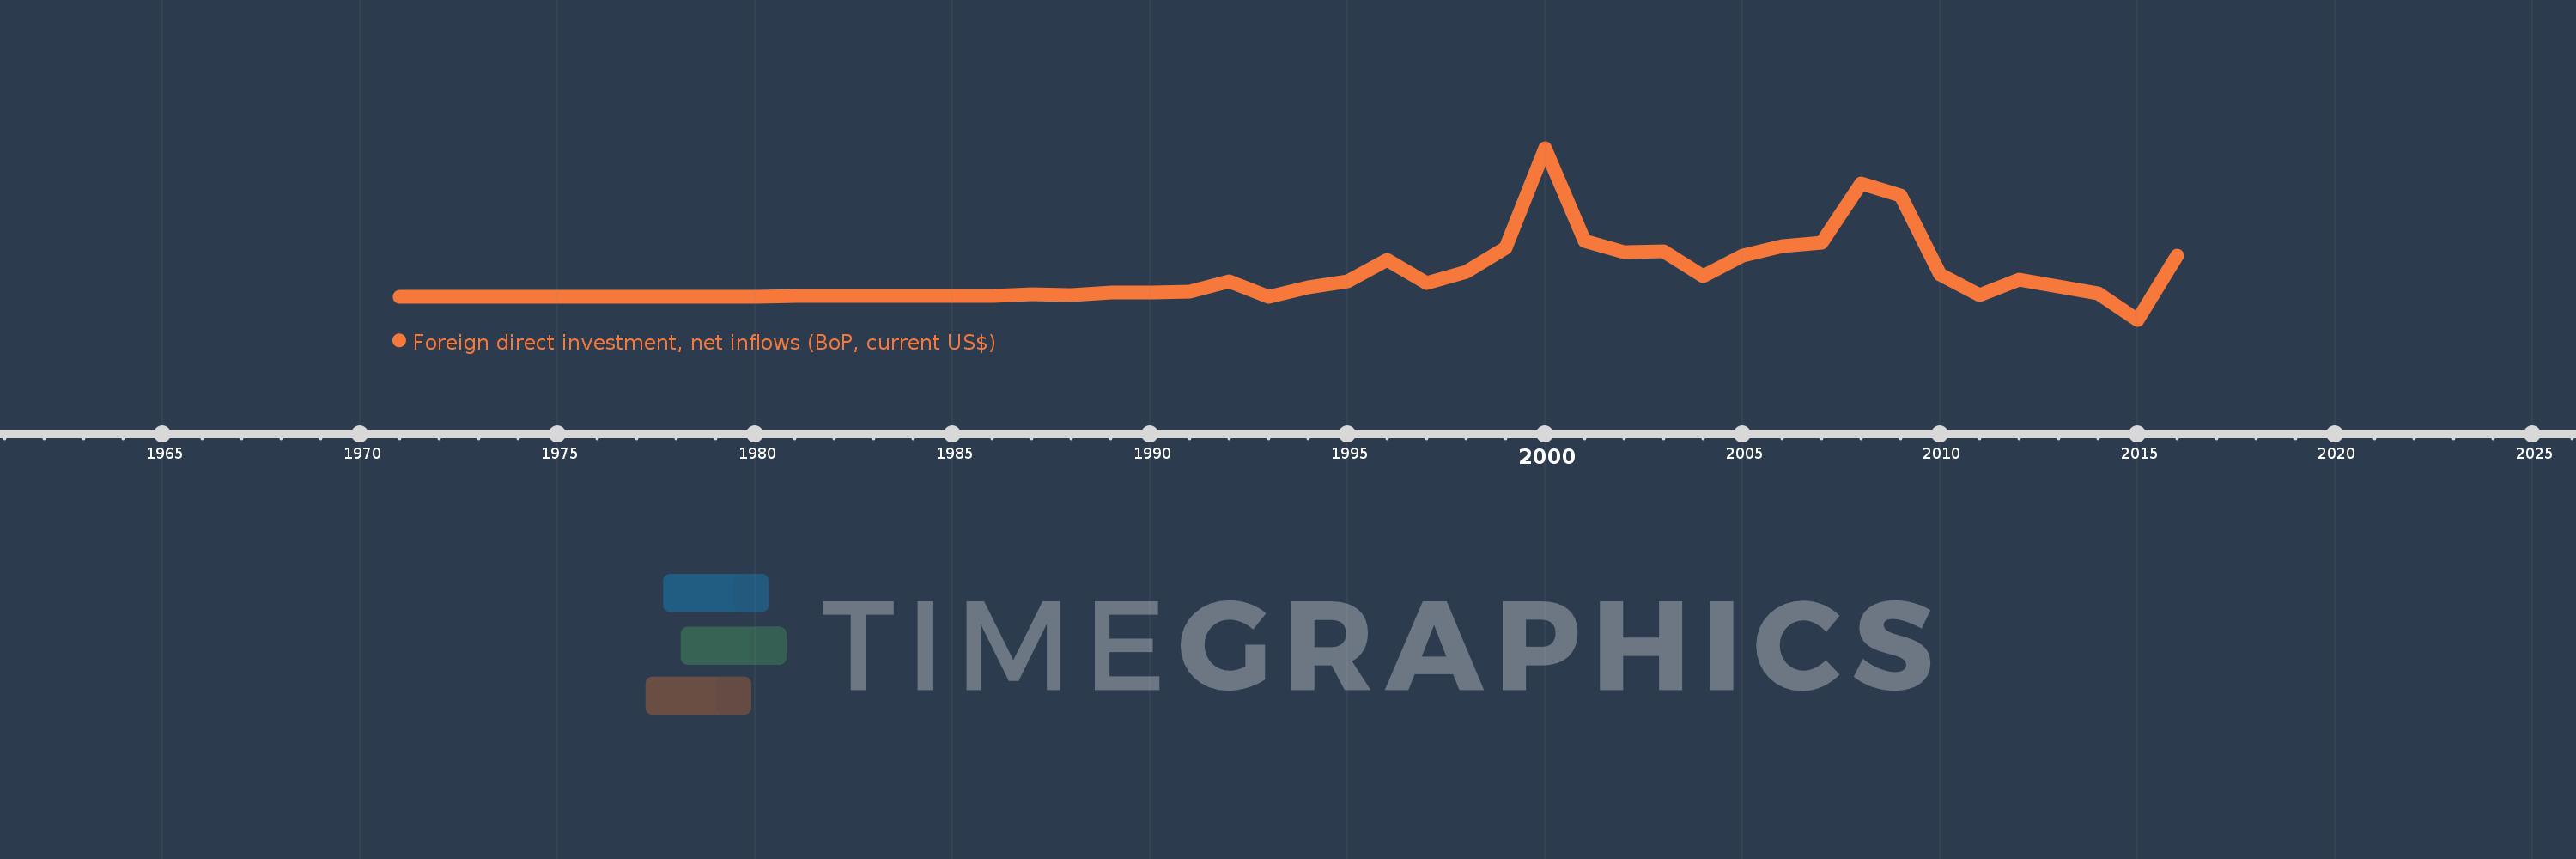
Foreign direct investment, net inflows (BoP, current US$)
2016,2015,2014,2013,2012,2011,2010,2009,2008,2007,2006,2005,2004,2003,2002,2001,2000,1999,1998,1997,1996,1995,1994,1993,1992,1991,1990,1989,1988,1987,1986,1985,1984,1983,1982,1981,1980,1979,1978,1977,1976,1975,1974,1973,1972,1971
This statistics in other country:
AfghanistanAlbaniaAlgeriaAngolaAntigua and BarbudaArab WorldArgentinaArmeniaArubaAustraliaAustriaAzerbaijanBahamas, TheBahrainBangladeshBarbadosBelarusBelgiumBelizeBeninBermudaBhutanBoliviaBosnia and HerzegovinaBotswanaBrazilBritish Virgin IslandsBrunei DarussalamBulgariaBurkina FasoBurundiCabo VerdeCambodiaCameroonCanadaCaribbean small statesCayman IslandsCentral African RepublicCentral Europe and the BalticsChadChileChinaColombiaComorosCongo, Dem. Rep.Congo, Rep.Costa RicaCote d'IvoireCroatiaCuracaoCyprusCzech RepublicDenmarkDjiboutiDominicaDominican RepublicEarly-demographic dividendEast Asia & PacificEast Asia & Pacific (excluding high income)East Asia & Pacific (IDA & IBRD countries)EcuadorEgypt, Arab Rep.El SalvadorEquatorial GuineaEritreaEstoniaEthiopiaEuro areaEurope & Central AsiaEurope & Central Asia (excluding high income)Europe & Central Asia (IDA & IBRD countries)European UnionFijiFinlandFragile and conflict affected situationsFranceFrench PolynesiaGabonGambia, TheGeorgiaGermanyGhanaGibraltarGreeceGrenadaGuatemalaGuineaGuinea-BissauGuyanaHaitiHeavily indebted poor countries (HIPC)High incomeHondurasHong Kong SAR, ChinaHungaryIBRD onlyIcelandIDA & IBRD totalIDA blendIDA onlyIDA totalIndiaIndonesiaIran, Islamic Rep.IraqIrelandIsraelItalyJamaicaJapanJordanKazakhstanKenyaKiribatiKorea, Dem. People’s Rep.Korea, Rep.KosovoKuwaitKyrgyz RepublicLao PDRLate-demographic dividendLatin America & Caribbean Latin America & Caribbean (excluding high income)Latin America & the Caribbean (IDA & IBRD countries)LatviaLeast developed countries: UN classificationLebanonLesothoLiberiaLibyaLithuaniaLow & middle incomeLow incomeLower middle incomeLuxembourgMacao SAR, ChinaMacedonia, FYRMadagascarMalawiMalaysiaMaldivesMaliMaltaMarshall IslandsMauritaniaMauritiusMexicoMicronesia, Fed. Sts.Middle East & North AfricaMiddle East & North Africa (excluding high income)Middle East & North Africa (IDA & IBRD countries)Middle incomeMoldovaMongoliaMontenegroMoroccoMozambiqueMyanmarNamibiaNauruNepalNetherlandsNew CaledoniaNew ZealandNicaraguaNigerNigeriaNorth AmericaNorthern Mariana IslandsNorwayOECD membersOmanOther small statesPacific island small statesPakistanPalauPanamaPapua New GuineaParaguayPeruPhilippinesPolandPortugalPost-demographic dividendPre-demographic dividendQatarRomaniaRussian FederationRwandaSamoaSao Tome and PrincipeSaudi ArabiaSenegalSerbiaSeychellesSierra LeoneSingaporeSint Maarten (Dutch part)Slovak RepublicSloveniaSmall statesSolomon IslandsSomaliaSouth AfricaSouth AsiaSouth Asia (IDA & IBRD)South SudanSpainSri LankaSt. Kitts and NevisSt. LuciaSt. Vincent and the GrenadinesSub-Saharan Africa Sub-Saharan Africa (excluding high income)Sub-Saharan Africa (IDA & IBRD countries)SudanSurinameSwazilandSwedenSwitzerlandSyrian Arab RepublicTajikistanTanzaniaThailandTimor-LesteTogoTongaTrinidad and TobagoTunisiaTurkeyTurkmenistanTuvaluUgandaUkraineUnited Arab EmiratesUnited KingdomUnited StatesUpper middle incomeUruguayUzbekistanVanuatuVenezuela, RBVietnamWest Bank and GazaWorldYemen, Rep.ZambiaZimbabwe Timeline:
This timeline shows a graph from 1971 to 2016 of Sweden. No data until 1970. Number of actual observations by date: 46.
Source name:
World Development Indicators
Source organization:
International Monetary Fund, Balance of Payments database, supplemented by data from the United Nations Conference on Trade and Development and official national sources.
Categories, topics:
Economy & Growth, Financial Sector, External Debt
Last updated:
apr 23, 2017
Indicators value changes by year
Minimum:
-9.347 bln
jan 1, 2015
Maximum:
60.627 bln
jan 1, 2000
At the date of observation
Value
Absolute change
Change from previous value
jan 1, 1971
108.25 mln
+108.25 mln
0.0%
jan 1, 1972
84.1 mln
-24.15 mln
-22.31%
jan 1, 1973
65.306 mln
-18.794 mln
-22.35%
jan 1, 1974
83.964 mln
+18.657 mln
28.57%
jan 1, 1975
76.586 mln
-7.377 mln
-8.79%
jan 1, 1976
80.215 mln
+3.629 mln
4.74%
jan 1, 1977
4.864 mln
-75.351 mln
-93.94%
jan 1, 1978
81.454 mln
+76.589 mln
1.57K%
jan 1, 1979
69.712 mln
-11.742 mln
-14.42%
jan 1, 1980
112.47 mln
+42.758 mln
61.33%
jan 1, 1981
250.912 mln
+138.442 mln
123.09%
jan 1, 1982
181.117 mln
-69.794 mln
-27.82%
jan 1, 1983
355.014 mln
+173.897 mln
96.01%
jan 1, 1984
225.698 mln
-129.316 mln
-36.43%
jan 1, 1985
290.015 mln
+64.317 mln
28.5%
jan 1, 1986
392.954 mln
+102.939 mln
35.49%
jan 1, 1987
1.083 bln
+689.702 mln
175.52%
jan 1, 1988
639.213 mln
-443.443 mln
-40.96%
jan 1, 1989
1.673 bln
+1.034 bln
161.79%
jan 1, 1990
1.812 bln
+138.579 mln
8.28%
jan 1, 1991
1.982 bln
+170.42 mln
9.41%
jan 1, 1992
6.351 bln
+4.368 bln
220.36%
jan 1, 1993
-5.419 mln
-6.356 bln
-100.09%
jan 1, 1994
3.705 bln
+3.71 bln
-68.47K%
jan 1, 1995
6.269 bln
+2.564 bln
69.2%
jan 1, 1996
14.939 bln
+8.671 bln
138.31%
jan 1, 1997
5.492 bln
-9.447 bln
-63.24%
jan 1, 1998
10.271 bln
+4.779 bln
87.02%
jan 1, 1999
20.017 bln
+9.746 bln
94.89%
jan 1, 2000
60.627 bln
+40.609 bln
202.87%
jan 1, 2001
22.818 bln
-37.809 bln
-62.36%
jan 1, 2002
18.218 bln
-4.6 bln
-20.16%
jan 1, 2003
18.382 bln
+163.835 mln
0.9%
jan 1, 2004
8.228 bln
-10.153 bln
-55.24%
jan 1, 2005
16.817 bln
+8.588 bln
104.37%
jan 1, 2006
20.783 bln
+3.966 bln
23.58%
jan 1, 2007
22.053 bln
+1.27 bln
6.11%
jan 1, 2008
46.144 bln
+24.091 bln
109.24%
jan 1, 2009
41.437 bln
-4.707 bln
-10.2%
jan 1, 2010
8.961 bln
-32.476 bln
-78.37%
jan 1, 2011
625.102 mln
-8.336 bln
-93.02%
jan 1, 2012
6.979 bln
+6.354 bln
1.02K%
jan 1, 2013
4.274 bln
-2.706 bln
-38.77%
jan 1, 2014
1.544 bln
-2.73 bln
-63.88%
jan 1, 2015
-9.347 bln
-10.891 bln
-705.5%
jan 1, 2016
16.682 bln
+26.029 bln
-278.46%
Ranking of countries by current statistics by years


Comments: