29
/
en
AIzaSyAYiBZKx7MnpbEhh9jyipgxe19OcubqV5w
April 1, 2024
223546
Philippines
PHL
true
2
1
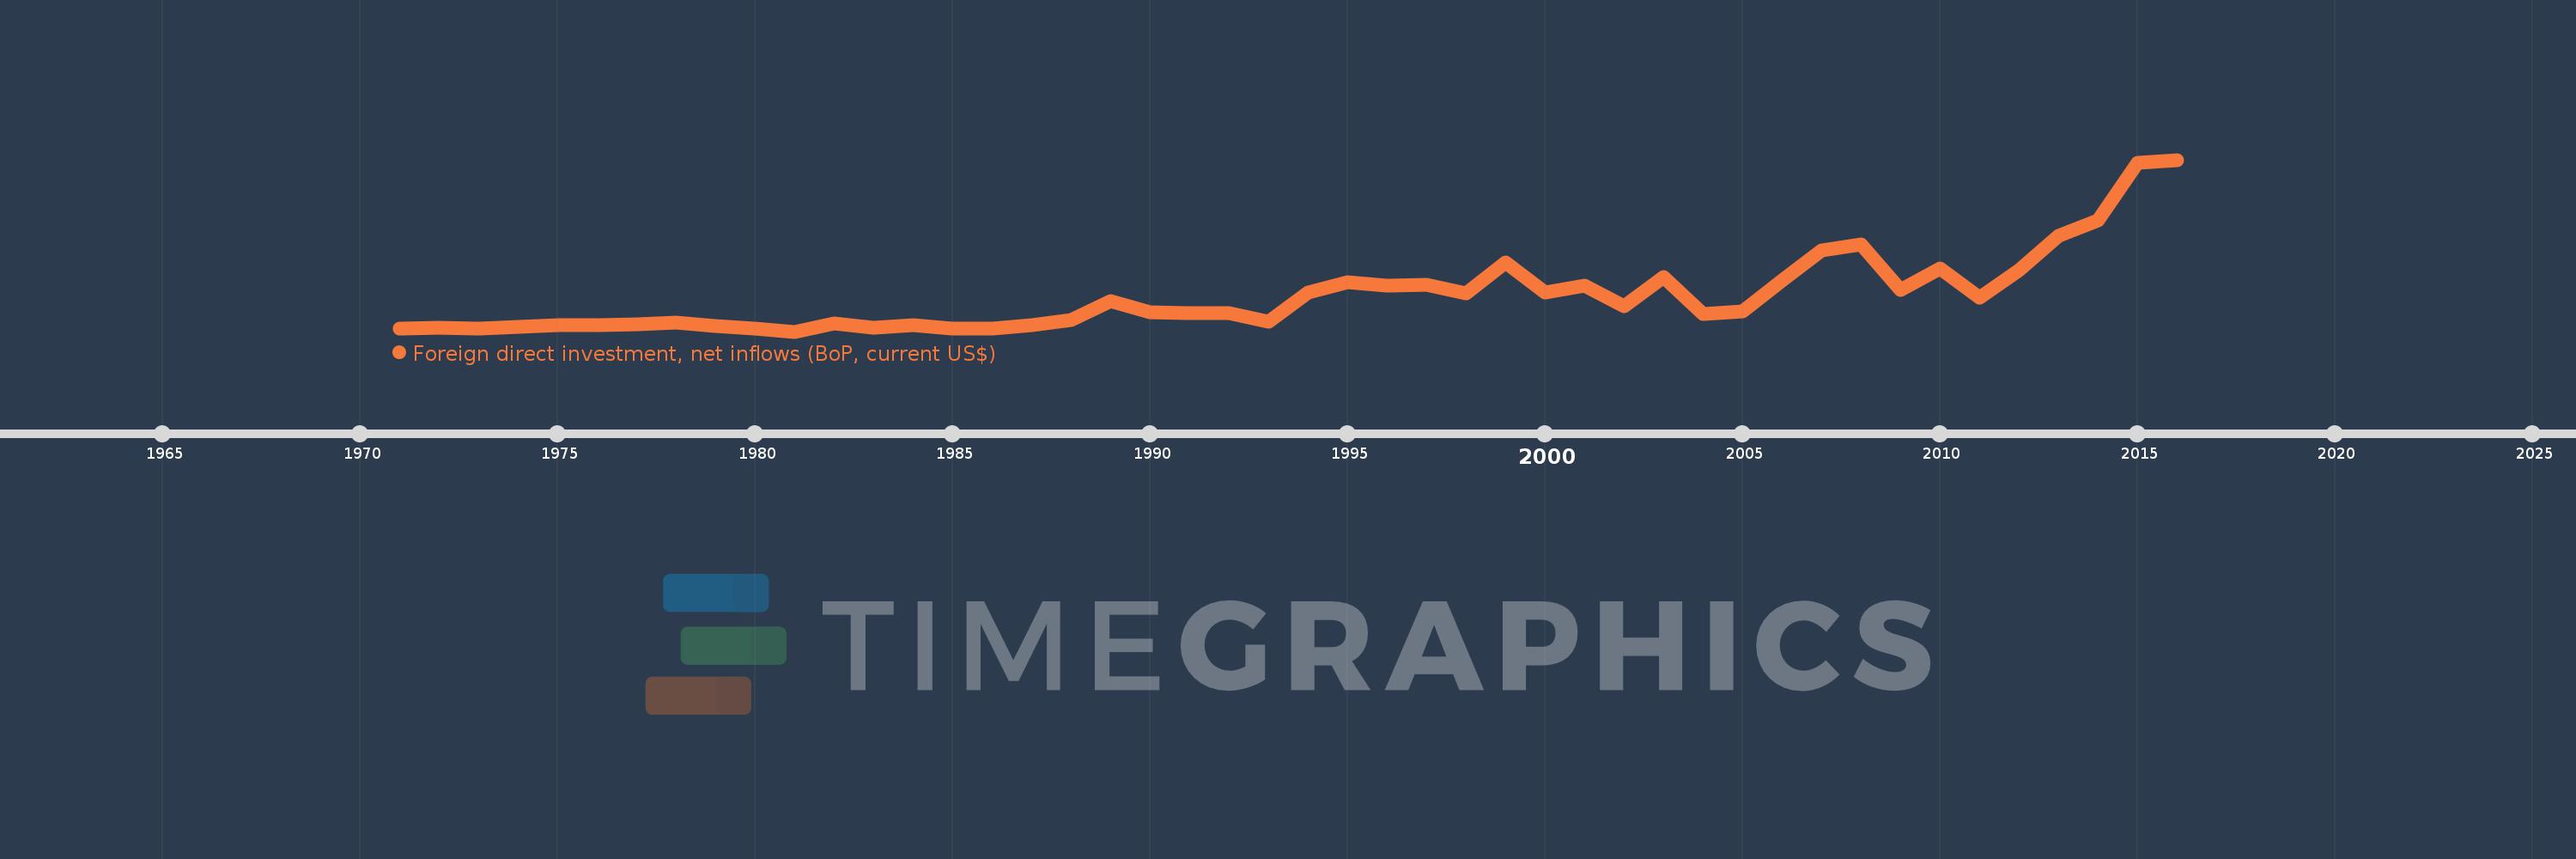
Foreign direct investment, net inflows (BoP, current US$)
2016,2015,2014,2013,2012,2011,2010,2009,2008,2007,2006,2005,2004,2003,2002,2001,2000,1999,1998,1997,1996,1995,1994,1993,1992,1991,1990,1989,1988,1987,1986,1985,1984,1983,1982,1981,1980,1979,1978,1977,1976,1975,1974,1973,1972,1971
This statistics in other country:
AfghanistanAlbaniaAlgeriaAngolaAntigua and BarbudaArab WorldArgentinaArmeniaArubaAustraliaAustriaAzerbaijanBahamas, TheBahrainBangladeshBarbadosBelarusBelgiumBelizeBeninBermudaBhutanBoliviaBosnia and HerzegovinaBotswanaBrazilBritish Virgin IslandsBrunei DarussalamBulgariaBurkina FasoBurundiCabo VerdeCambodiaCameroonCanadaCaribbean small statesCayman IslandsCentral African RepublicCentral Europe and the BalticsChadChileChinaColombiaComorosCongo, Dem. Rep.Congo, Rep.Costa RicaCote d'IvoireCroatiaCuracaoCyprusCzech RepublicDenmarkDjiboutiDominicaDominican RepublicEarly-demographic dividendEast Asia & PacificEast Asia & Pacific (excluding high income)East Asia & Pacific (IDA & IBRD countries)EcuadorEgypt, Arab Rep.El SalvadorEquatorial GuineaEritreaEstoniaEthiopiaEuro areaEurope & Central AsiaEurope & Central Asia (excluding high income)Europe & Central Asia (IDA & IBRD countries)European UnionFijiFinlandFragile and conflict affected situationsFranceFrench PolynesiaGabonGambia, TheGeorgiaGermanyGhanaGibraltarGreeceGrenadaGuatemalaGuineaGuinea-BissauGuyanaHaitiHeavily indebted poor countries (HIPC)High incomeHondurasHong Kong SAR, ChinaHungaryIBRD onlyIcelandIDA & IBRD totalIDA blendIDA onlyIDA totalIndiaIndonesiaIran, Islamic Rep.IraqIrelandIsraelItalyJamaicaJapanJordanKazakhstanKenyaKiribatiKorea, Dem. People’s Rep.Korea, Rep.KosovoKuwaitKyrgyz RepublicLao PDRLate-demographic dividendLatin America & Caribbean Latin America & Caribbean (excluding high income)Latin America & the Caribbean (IDA & IBRD countries)LatviaLeast developed countries: UN classificationLebanonLesothoLiberiaLibyaLithuaniaLow & middle incomeLow incomeLower middle incomeLuxembourgMacao SAR, ChinaMacedonia, FYRMadagascarMalawiMalaysiaMaldivesMaliMaltaMarshall IslandsMauritaniaMauritiusMexicoMicronesia, Fed. Sts.Middle East & North AfricaMiddle East & North Africa (excluding high income)Middle East & North Africa (IDA & IBRD countries)Middle incomeMoldovaMongoliaMontenegroMoroccoMozambiqueMyanmarNamibiaNauruNepalNetherlandsNew CaledoniaNew ZealandNicaraguaNigerNigeriaNorth AmericaNorthern Mariana IslandsNorwayOECD membersOmanOther small statesPacific island small statesPakistanPalauPanamaPapua New GuineaParaguayPeruPhilippinesPolandPortugalPost-demographic dividendPre-demographic dividendQatarRomaniaRussian FederationRwandaSamoaSao Tome and PrincipeSaudi ArabiaSenegalSerbiaSeychellesSierra LeoneSingaporeSint Maarten (Dutch part)Slovak RepublicSloveniaSmall statesSolomon IslandsSomaliaSouth AfricaSouth AsiaSouth Asia (IDA & IBRD)South SudanSpainSri LankaSt. Kitts and NevisSt. LuciaSt. Vincent and the GrenadinesSub-Saharan Africa Sub-Saharan Africa (excluding high income)Sub-Saharan Africa (IDA & IBRD countries)SudanSurinameSwazilandSwedenSwitzerlandSyrian Arab RepublicTajikistanTanzaniaThailandTimor-LesteTogoTongaTrinidad and TobagoTunisiaTurkeyTurkmenistanTuvaluUgandaUkraineUnited Arab EmiratesUnited KingdomUnited StatesUpper middle incomeUruguayUzbekistanVanuatuVenezuela, RBVietnamWest Bank and GazaWorldYemen, Rep.ZambiaZimbabwe Timeline:
This timeline shows a graph from 1971 to 2016 of Philippines. No data until 1970. Number of actual observations by date: 46.
Source name:
World Development Indicators
Source organization:
International Monetary Fund, Balance of Payments database, supplemented by data from the United Nations Conference on Trade and Development and official national sources.
Categories, topics:
Economy & Growth, Financial Sector, External Debt
Last updated:
apr 23, 2017
Indicators value changes by year
Minimum:
-106.0 mln
jan 1, 1981
Maximum:
5.835 bln
jan 1, 2016
At the date of observation
Value
Absolute change
Change from previous value
jan 1, 1971
-1.04 mln
-1.04 mln
0.0%
jan 1, 1972
21.59 mln
+22.63 mln
-2.18K%
jan 1, 1973
4.1 mln
-17.49 mln
-81.01%
jan 1, 1974
59.3 mln
+55.2 mln
1.35K%
jan 1, 1975
130.74 mln
+71.44 mln
120.47%
jan 1, 1976
114.0 mln
-16.74 mln
-12.8%
jan 1, 1977
153.5 mln
+39.5 mln
34.65%
jan 1, 1978
210.0 mln
+56.5 mln
36.81%
jan 1, 1979
101.0 mln
-109.0 mln
-51.9%
jan 1, 1980
7.0 mln
-94.0 mln
-93.07%
jan 1, 1981
-106.0 mln
-113.0 mln
-1.61K%
jan 1, 1982
172.0 mln
+278.0 mln
-262.26%
jan 1, 1983
16.0 mln
-156.0 mln
-90.7%
jan 1, 1984
105.0 mln
+89.0 mln
556.25%
jan 1, 1985
9.0 mln
-96.0 mln
-91.43%
jan 1, 1986
12.0 mln
+3.0 mln
33.33%
jan 1, 1987
127.0 mln
+115.0 mln
958.33%
jan 1, 1988
307.0 mln
+180.0 mln
141.73%
jan 1, 1989
936.0 mln
+629.0 mln
204.89%
jan 1, 1990
563.0 mln
-373.0 mln
-39.85%
jan 1, 1991
530.0 mln
-33.0 mln
-5.86%
jan 1, 1992
544.0 mln
+14.0 mln
2.64%
jan 1, 1993
228.0 mln
-316.0 mln
-58.09%
jan 1, 1994
1.238 bln
+1.01 bln
442.98%
jan 1, 1995
1.591 bln
+353.0 mln
28.51%
jan 1, 1996
1.478 bln
-113.0 mln
-7.1%
jan 1, 1997
1.517 bln
+39.0 mln
2.64%
jan 1, 1998
1.222 bln
-295.0 mln
-19.45%
jan 1, 1999
2.287 bln
+1.065 bln
87.15%
jan 1, 2000
1.247 bln
-1.04 bln
-45.47%
jan 1, 2001
1.487 bln
+240.0 mln
19.25%
jan 1, 2002
760.0 mln
-727.0 mln
-48.89%
jan 1, 2003
1.769 bln
+1.009 bln
132.76%
jan 1, 2004
492.0 mln
-1.277 bln
-72.19%
jan 1, 2005
592.0 mln
+100.0 mln
20.33%
jan 1, 2006
1.664 bln
+1.072 bln
181.08%
jan 1, 2007
2.707 bln
+1.043 bln
62.71%
jan 1, 2008
2.919 bln
+211.31 mln
7.8%
jan 1, 2009
1.34 bln
-1.579 bln
-54.09%
jan 1, 2010
2.065 bln
+724.593 mln
54.07%
jan 1, 2011
1.07 bln
-994.234 mln
-48.16%
jan 1, 2012
2.007 bln
+936.764 mln
87.52%
jan 1, 2013
3.215 bln
+1.208 bln
60.2%
jan 1, 2014
3.737 bln
+521.957 mln
16.23%
jan 1, 2015
5.74 bln
+2.002 bln
53.57%
jan 1, 2016
5.835 bln
+95.685 mln
1.67%
Ranking of countries by current statistics by years


Comments: