29
/
en
AIzaSyAYiBZKx7MnpbEhh9jyipgxe19OcubqV5w
April 1, 2024
247528
Spain
ESP
true
2
1
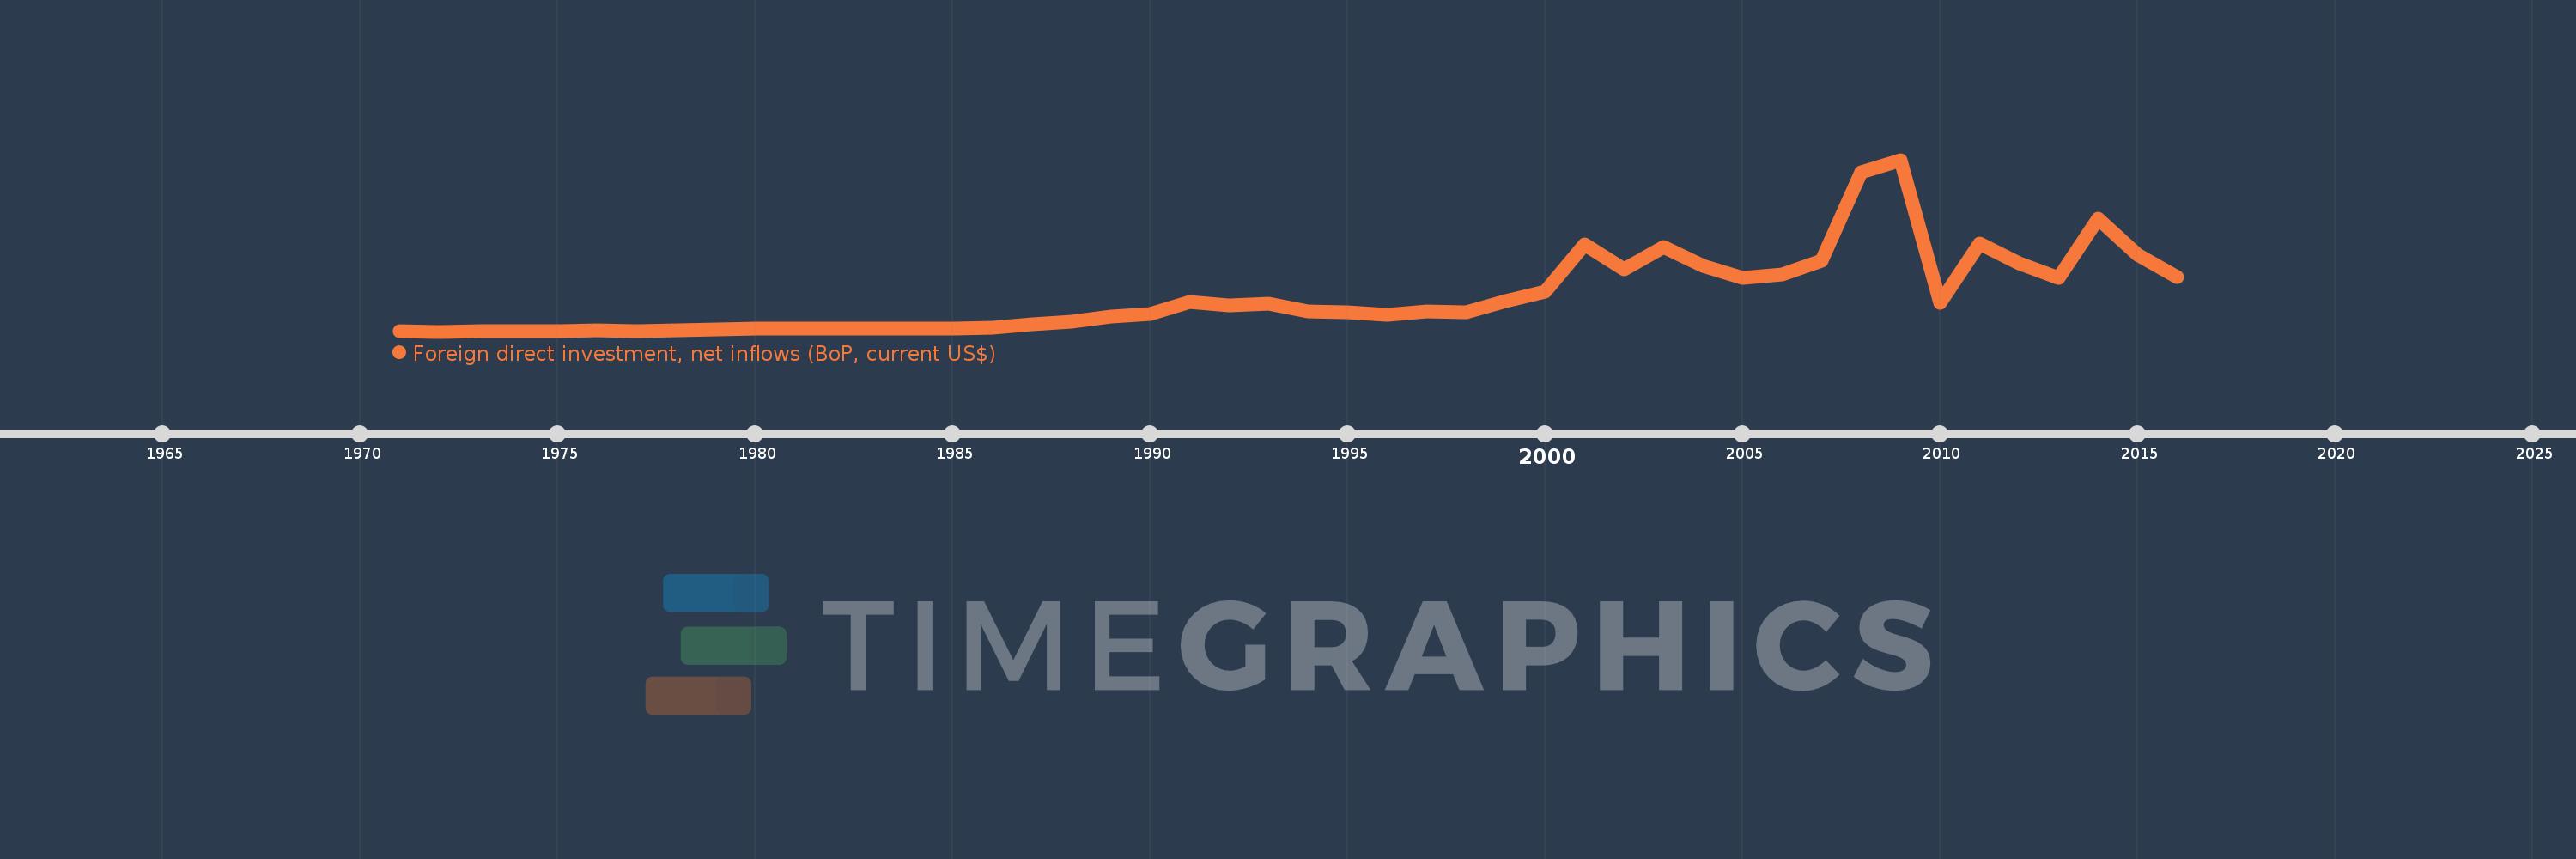
Foreign direct investment, net inflows (BoP, current US$)
2016,2015,2014,2013,2012,2011,2010,2009,2008,2007,2006,2005,2004,2003,2002,2001,2000,1999,1998,1997,1996,1995,1994,1993,1992,1991,1990,1989,1988,1987,1986,1985,1984,1983,1982,1981,1980,1979,1978,1977,1976,1975,1974,1973,1972,1971
This statistics in other country:
AfghanistanAlbaniaAlgeriaAngolaAntigua and BarbudaArab WorldArgentinaArmeniaArubaAustraliaAustriaAzerbaijanBahamas, TheBahrainBangladeshBarbadosBelarusBelgiumBelizeBeninBermudaBhutanBoliviaBosnia and HerzegovinaBotswanaBrazilBritish Virgin IslandsBrunei DarussalamBulgariaBurkina FasoBurundiCabo VerdeCambodiaCameroonCanadaCaribbean small statesCayman IslandsCentral African RepublicCentral Europe and the BalticsChadChileChinaColombiaComorosCongo, Dem. Rep.Congo, Rep.Costa RicaCote d'IvoireCroatiaCuracaoCyprusCzech RepublicDenmarkDjiboutiDominicaDominican RepublicEarly-demographic dividendEast Asia & PacificEast Asia & Pacific (excluding high income)East Asia & Pacific (IDA & IBRD countries)EcuadorEgypt, Arab Rep.El SalvadorEquatorial GuineaEritreaEstoniaEthiopiaEuro areaEurope & Central AsiaEurope & Central Asia (excluding high income)Europe & Central Asia (IDA & IBRD countries)European UnionFijiFinlandFragile and conflict affected situationsFranceFrench PolynesiaGabonGambia, TheGeorgiaGermanyGhanaGibraltarGreeceGrenadaGuatemalaGuineaGuinea-BissauGuyanaHaitiHeavily indebted poor countries (HIPC)High incomeHondurasHong Kong SAR, ChinaHungaryIBRD onlyIcelandIDA & IBRD totalIDA blendIDA onlyIDA totalIndiaIndonesiaIran, Islamic Rep.IraqIrelandIsraelItalyJamaicaJapanJordanKazakhstanKenyaKiribatiKorea, Dem. People’s Rep.Korea, Rep.KosovoKuwaitKyrgyz RepublicLao PDRLate-demographic dividendLatin America & Caribbean Latin America & Caribbean (excluding high income)Latin America & the Caribbean (IDA & IBRD countries)LatviaLeast developed countries: UN classificationLebanonLesothoLiberiaLibyaLithuaniaLow & middle incomeLow incomeLower middle incomeLuxembourgMacao SAR, ChinaMacedonia, FYRMadagascarMalawiMalaysiaMaldivesMaliMaltaMarshall IslandsMauritaniaMauritiusMexicoMicronesia, Fed. Sts.Middle East & North AfricaMiddle East & North Africa (excluding high income)Middle East & North Africa (IDA & IBRD countries)Middle incomeMoldovaMongoliaMontenegroMoroccoMozambiqueMyanmarNamibiaNauruNepalNetherlandsNew CaledoniaNew ZealandNicaraguaNigerNigeriaNorth AmericaNorthern Mariana IslandsNorwayOECD membersOmanOther small statesPacific island small statesPakistanPalauPanamaPapua New GuineaParaguayPeruPhilippinesPolandPortugalPost-demographic dividendPre-demographic dividendQatarRomaniaRussian FederationRwandaSamoaSao Tome and PrincipeSaudi ArabiaSenegalSerbiaSeychellesSierra LeoneSingaporeSint Maarten (Dutch part)Slovak RepublicSloveniaSmall statesSolomon IslandsSomaliaSouth AfricaSouth AsiaSouth Asia (IDA & IBRD)South SudanSpainSri LankaSt. Kitts and NevisSt. LuciaSt. Vincent and the GrenadinesSub-Saharan Africa Sub-Saharan Africa (excluding high income)Sub-Saharan Africa (IDA & IBRD countries)SudanSurinameSwazilandSwedenSwitzerlandSyrian Arab RepublicTajikistanTanzaniaThailandTimor-LesteTogoTongaTrinidad and TobagoTunisiaTurkeyTurkmenistanTuvaluUgandaUkraineUnited Arab EmiratesUnited KingdomUnited StatesUpper middle incomeUruguayUzbekistanVanuatuVenezuela, RBVietnamWest Bank and GazaWorldYemen, Rep.ZambiaZimbabwe Timeline:
This timeline shows a graph from 1971 to 2016 of Spain. No data until 1970. Number of actual observations by date: 46.
Source name:
World Development Indicators
Source organization:
International Monetary Fund, Balance of Payments database, supplemented by data from the United Nations Conference on Trade and Development and official national sources.
Categories, topics:
Economy & Growth, Financial Sector, External Debt
Last updated:
apr 23, 2017
Indicators value changes by year
Minimum:
202.0 mln
jan 1, 1972
Maximum:
79.558 bln
jan 1, 2009
At the date of observation
Value
Absolute change
Change from previous value
jan 1, 1971
222.0 mln
+222.0 mln
0.0%
jan 1, 1972
202.0 mln
-20.0 mln
-9.01%
jan 1, 1973
268.0 mln
+66.0 mln
32.67%
jan 1, 1974
390.0 mln
+122.0 mln
45.52%
jan 1, 1975
358.0 mln
-32.0 mln
-8.21%
jan 1, 1976
682.635 mln
+324.635 mln
90.68%
jan 1, 1977
477.622 mln
-205.013 mln
-30.03%
jan 1, 1978
607.675 mln
+130.053 mln
27.23%
jan 1, 1979
1.178 bln
+570.481 mln
93.88%
jan 1, 1980
1.397 bln
+218.654 mln
18.56%
jan 1, 1981
1.493 bln
+95.887 mln
6.86%
jan 1, 1982
1.707 bln
+214.07 mln
14.34%
jan 1, 1983
1.783 bln
+75.918 mln
4.45%
jan 1, 1984
1.622 bln
-160.296 mln
-8.99%
jan 1, 1985
1.772 bln
+149.441 mln
9.21%
jan 1, 1986
1.968 bln
+195.975 mln
11.06%
jan 1, 1987
3.451 bln
+1.483 bln
75.35%
jan 1, 1988
4.571 bln
+1.12 bln
32.46%
jan 1, 1989
7.021 bln
+2.45 bln
53.6%
jan 1, 1990
8.428 bln
+1.408 bln
20.05%
jan 1, 1991
13.984 bln
+5.555 bln
65.91%
jan 1, 1992
12.493 bln
-1.491 bln
-10.66%
jan 1, 1993
13.276 bln
+782.94 mln
6.27%
jan 1, 1994
9.681 bln
-3.594 bln
-27.07%
jan 1, 1995
9.216 bln
-465.714 mln
-4.81%
jan 1, 1996
8.086 bln
-1.13 bln
-12.26%
jan 1, 1997
9.623 bln
+1.538 bln
19.02%
jan 1, 1998
8.937 bln
-685.994 mln
-7.13%
jan 1, 1999
14.282 bln
+5.345 bln
59.81%
jan 1, 2000
18.523 bln
+4.241 bln
29.7%
jan 1, 2001
40.489 bln
+21.966 bln
118.59%
jan 1, 2002
28.892 bln
-11.597 bln
-28.64%
jan 1, 2003
39.41 bln
+10.517 bln
36.4%
jan 1, 2004
30.74 bln
-8.669 bln
-22.0%
jan 1, 2005
25.176 bln
-5.564 bln
-18.1%
jan 1, 2006
26.72 bln
+1.544 bln
6.13%
jan 1, 2007
32.99 bln
+6.269 bln
23.46%
jan 1, 2008
73.773 bln
+40.783 bln
123.62%
jan 1, 2009
79.558 bln
+5.785 bln
7.84%
jan 1, 2010
13.479 bln
-66.079 bln
-83.06%
jan 1, 2011
41.02 bln
+27.541 bln
204.33%
jan 1, 2012
31.782 bln
-9.238 bln
-22.52%
jan 1, 2013
24.915 bln
-6.867 bln
-21.61%
jan 1, 2014
52.288 bln
+27.373 bln
109.86%
jan 1, 2015
35.776 bln
-16.512 bln
-31.58%
jan 1, 2016
25.299 bln
-10.477 bln
-29.28%
Ranking of countries by current statistics by years


Comments: