29
/
en
AIzaSyAYiBZKx7MnpbEhh9jyipgxe19OcubqV5w
April 1, 2024
79433
Barbados
BRB
true
2
1
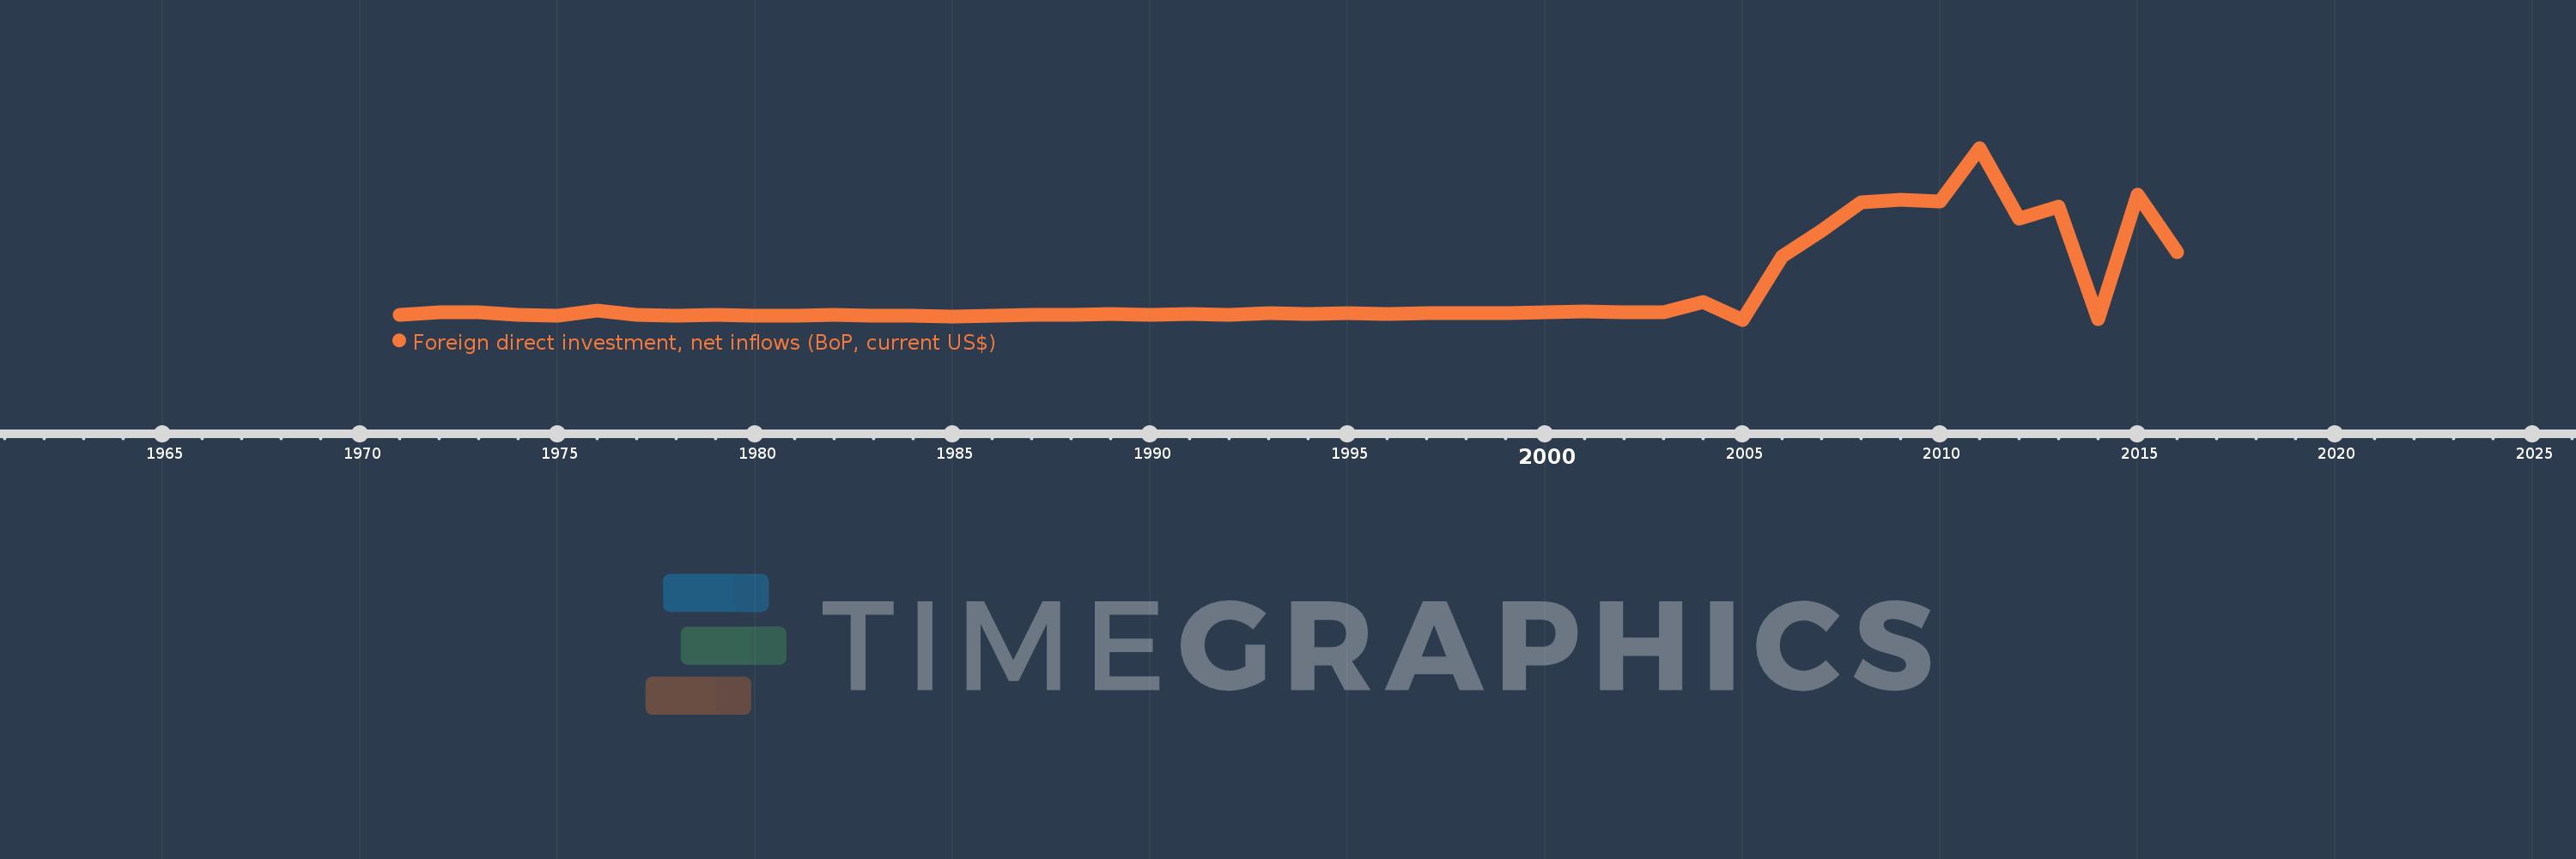
Foreign direct investment, net inflows (BoP, current US$)
2016,2015,2014,2013,2012,2011,2010,2009,2008,2007,2006,2005,2004,2003,2002,2001,2000,1999,1998,1997,1996,1995,1994,1993,1992,1991,1990,1989,1988,1987,1986,1985,1984,1983,1982,1981,1980,1979,1978,1977,1976,1975,1974,1973,1972,1971
This statistics in other country:
AfghanistanAlbaniaAlgeriaAngolaAntigua and BarbudaArab WorldArgentinaArmeniaArubaAustraliaAustriaAzerbaijanBahamas, TheBahrainBangladeshBarbadosBelarusBelgiumBelizeBeninBermudaBhutanBoliviaBosnia and HerzegovinaBotswanaBrazilBritish Virgin IslandsBrunei DarussalamBulgariaBurkina FasoBurundiCabo VerdeCambodiaCameroonCanadaCaribbean small statesCayman IslandsCentral African RepublicCentral Europe and the BalticsChadChileChinaColombiaComorosCongo, Dem. Rep.Congo, Rep.Costa RicaCote d'IvoireCroatiaCuracaoCyprusCzech RepublicDenmarkDjiboutiDominicaDominican RepublicEarly-demographic dividendEast Asia & PacificEast Asia & Pacific (excluding high income)East Asia & Pacific (IDA & IBRD countries)EcuadorEgypt, Arab Rep.El SalvadorEquatorial GuineaEritreaEstoniaEthiopiaEuro areaEurope & Central AsiaEurope & Central Asia (excluding high income)Europe & Central Asia (IDA & IBRD countries)European UnionFijiFinlandFragile and conflict affected situationsFranceFrench PolynesiaGabonGambia, TheGeorgiaGermanyGhanaGibraltarGreeceGrenadaGuatemalaGuineaGuinea-BissauGuyanaHaitiHeavily indebted poor countries (HIPC)High incomeHondurasHong Kong SAR, ChinaHungaryIBRD onlyIcelandIDA & IBRD totalIDA blendIDA onlyIDA totalIndiaIndonesiaIran, Islamic Rep.IraqIrelandIsraelItalyJamaicaJapanJordanKazakhstanKenyaKiribatiKorea, Dem. People’s Rep.Korea, Rep.KosovoKuwaitKyrgyz RepublicLao PDRLate-demographic dividendLatin America & Caribbean Latin America & Caribbean (excluding high income)Latin America & the Caribbean (IDA & IBRD countries)LatviaLeast developed countries: UN classificationLebanonLesothoLiberiaLibyaLithuaniaLow & middle incomeLow incomeLower middle incomeLuxembourgMacao SAR, ChinaMacedonia, FYRMadagascarMalawiMalaysiaMaldivesMaliMaltaMarshall IslandsMauritaniaMauritiusMexicoMicronesia, Fed. Sts.Middle East & North AfricaMiddle East & North Africa (excluding high income)Middle East & North Africa (IDA & IBRD countries)Middle incomeMoldovaMongoliaMontenegroMoroccoMozambiqueMyanmarNamibiaNauruNepalNetherlandsNew CaledoniaNew ZealandNicaraguaNigerNigeriaNorth AmericaNorthern Mariana IslandsNorwayOECD membersOmanOther small statesPacific island small statesPakistanPalauPanamaPapua New GuineaParaguayPeruPhilippinesPolandPortugalPost-demographic dividendPre-demographic dividendQatarRomaniaRussian FederationRwandaSamoaSao Tome and PrincipeSaudi ArabiaSenegalSerbiaSeychellesSierra LeoneSingaporeSint Maarten (Dutch part)Slovak RepublicSloveniaSmall statesSolomon IslandsSomaliaSouth AfricaSouth AsiaSouth Asia (IDA & IBRD)South SudanSpainSri LankaSt. Kitts and NevisSt. LuciaSt. Vincent and the GrenadinesSub-Saharan Africa Sub-Saharan Africa (excluding high income)Sub-Saharan Africa (IDA & IBRD countries)SudanSurinameSwazilandSwedenSwitzerlandSyrian Arab RepublicTajikistanTanzaniaThailandTimor-LesteTogoTongaTrinidad and TobagoTunisiaTurkeyTurkmenistanTuvaluUgandaUkraineUnited Arab EmiratesUnited KingdomUnited StatesUpper middle incomeUruguayUzbekistanVanuatuVenezuela, RBVietnamWest Bank and GazaWorldYemen, Rep.ZambiaZimbabwe Timeline:
This timeline shows a graph from 1971 to 2016 of Barbados. No data until 1970. Number of actual observations by date: 46.
Source name:
World Development Indicators
Source organization:
International Monetary Fund, Balance of Payments database, supplemented by data from the United Nations Conference on Trade and Development and official national sources.
Categories, topics:
Economy & Growth, Financial Sector, External Debt
Last updated:
apr 23, 2017
Indicators value changes by year
Minimum:
-12.1 mln
jan 1, 2005
Maximum:
668.828 mln
jan 1, 2011
At the date of observation
Value
Absolute change
Change from previous value
jan 1, 1971
8.65 mln
+8.65 mln
0.0%
jan 1, 1972
16.102 mln
+7.452 mln
86.15%
jan 1, 1973
17.28 mln
+1.178 mln
7.31%
jan 1, 1974
5.614 mln
-11.666 mln
-67.51%
jan 1, 1975
2.386 mln
-3.228 mln
-57.49%
jan 1, 1976
22.934 mln
+20.547 mln
860.98%
jan 1, 1977
6.9 mln
-16.034 mln
-69.91%
jan 1, 1978
4.9 mln
-2.0 mln
-28.99%
jan 1, 1979
9.0 mln
+4.1 mln
83.67%
jan 1, 1980
5.35 mln
-3.65 mln
-40.56%
jan 1, 1981
2.8 mln
-2.55 mln
-47.66%
jan 1, 1982
8.4 mln
+5.6 mln
200.0%
jan 1, 1983
4.65 mln
-3.75 mln
-44.64%
jan 1, 1984
3.65 mln
-1000.0K
-21.51%
jan 1, 1985
50.0K
-3.6 mln
-98.63%
jan 1, 1986
4.85 mln
+4.8 mln
9.6K%
jan 1, 1987
7.75 mln
+2.9 mln
59.79%
jan 1, 1988
7.1 mln
-650.0K
-8.39%
jan 1, 1989
11.55 mln
+4.45 mln
62.68%
jan 1, 1990
8.35 mln
-3.2 mln
-27.71%
jan 1, 1991
11.2 mln
+2.85 mln
34.13%
jan 1, 1992
7.4 mln
-3.8 mln
-33.93%
jan 1, 1993
14.45 mln
+7.05 mln
95.27%
jan 1, 1994
9.4 mln
-5.05 mln
-34.95%
jan 1, 1995
12.95 mln
+3.55 mln
37.77%
jan 1, 1996
11.75 mln
-1.2 mln
-9.27%
jan 1, 1997
13.3 mln
+1.55 mln
13.19%
jan 1, 1998
14.8 mln
+1.5 mln
11.28%
jan 1, 1999
15.75 mln
+950.0K
6.42%
jan 1, 2000
17.35 mln
+1.6 mln
10.16%
jan 1, 2001
19.4 mln
+2.05 mln
11.82%
jan 1, 2002
18.55 mln
-850.0K
-4.38%
jan 1, 2003
17.4 mln
-1.15 mln
-6.2%
jan 1, 2004
58.25 mln
+40.85 mln
234.77%
jan 1, 2005
-12.1 mln
-70.35 mln
-120.77%
jan 1, 2006
238.261 mln
+250.361 mln
-2.07K%
jan 1, 2007
342.244 mln
+103.983 mln
43.64%
jan 1, 2008
451.705 mln
+109.46 mln
31.98%
jan 1, 2009
462.038 mln
+10.333 mln
2.29%
jan 1, 2010
458.156 mln
-3.882 mln
-0.84%
jan 1, 2011
668.828 mln
+210.672 mln
45.98%
jan 1, 2012
387.635 mln
-281.192 mln
-42.04%
jan 1, 2013
437.173 mln
+49.538 mln
12.78%
jan 1, 2014
-8.084 mln
-445.257 mln
-101.85%
jan 1, 2015
485.583 mln
+493.667 mln
-6.11K%
jan 1, 2016
254.424 mln
-231.159 mln
-47.6%
Ranking of countries by current statistics by years


Comments: