29
/
en
AIzaSyAYiBZKx7MnpbEhh9jyipgxe19OcubqV5w
April 1, 2024
257288
Switzerland
CHE
true
2
1
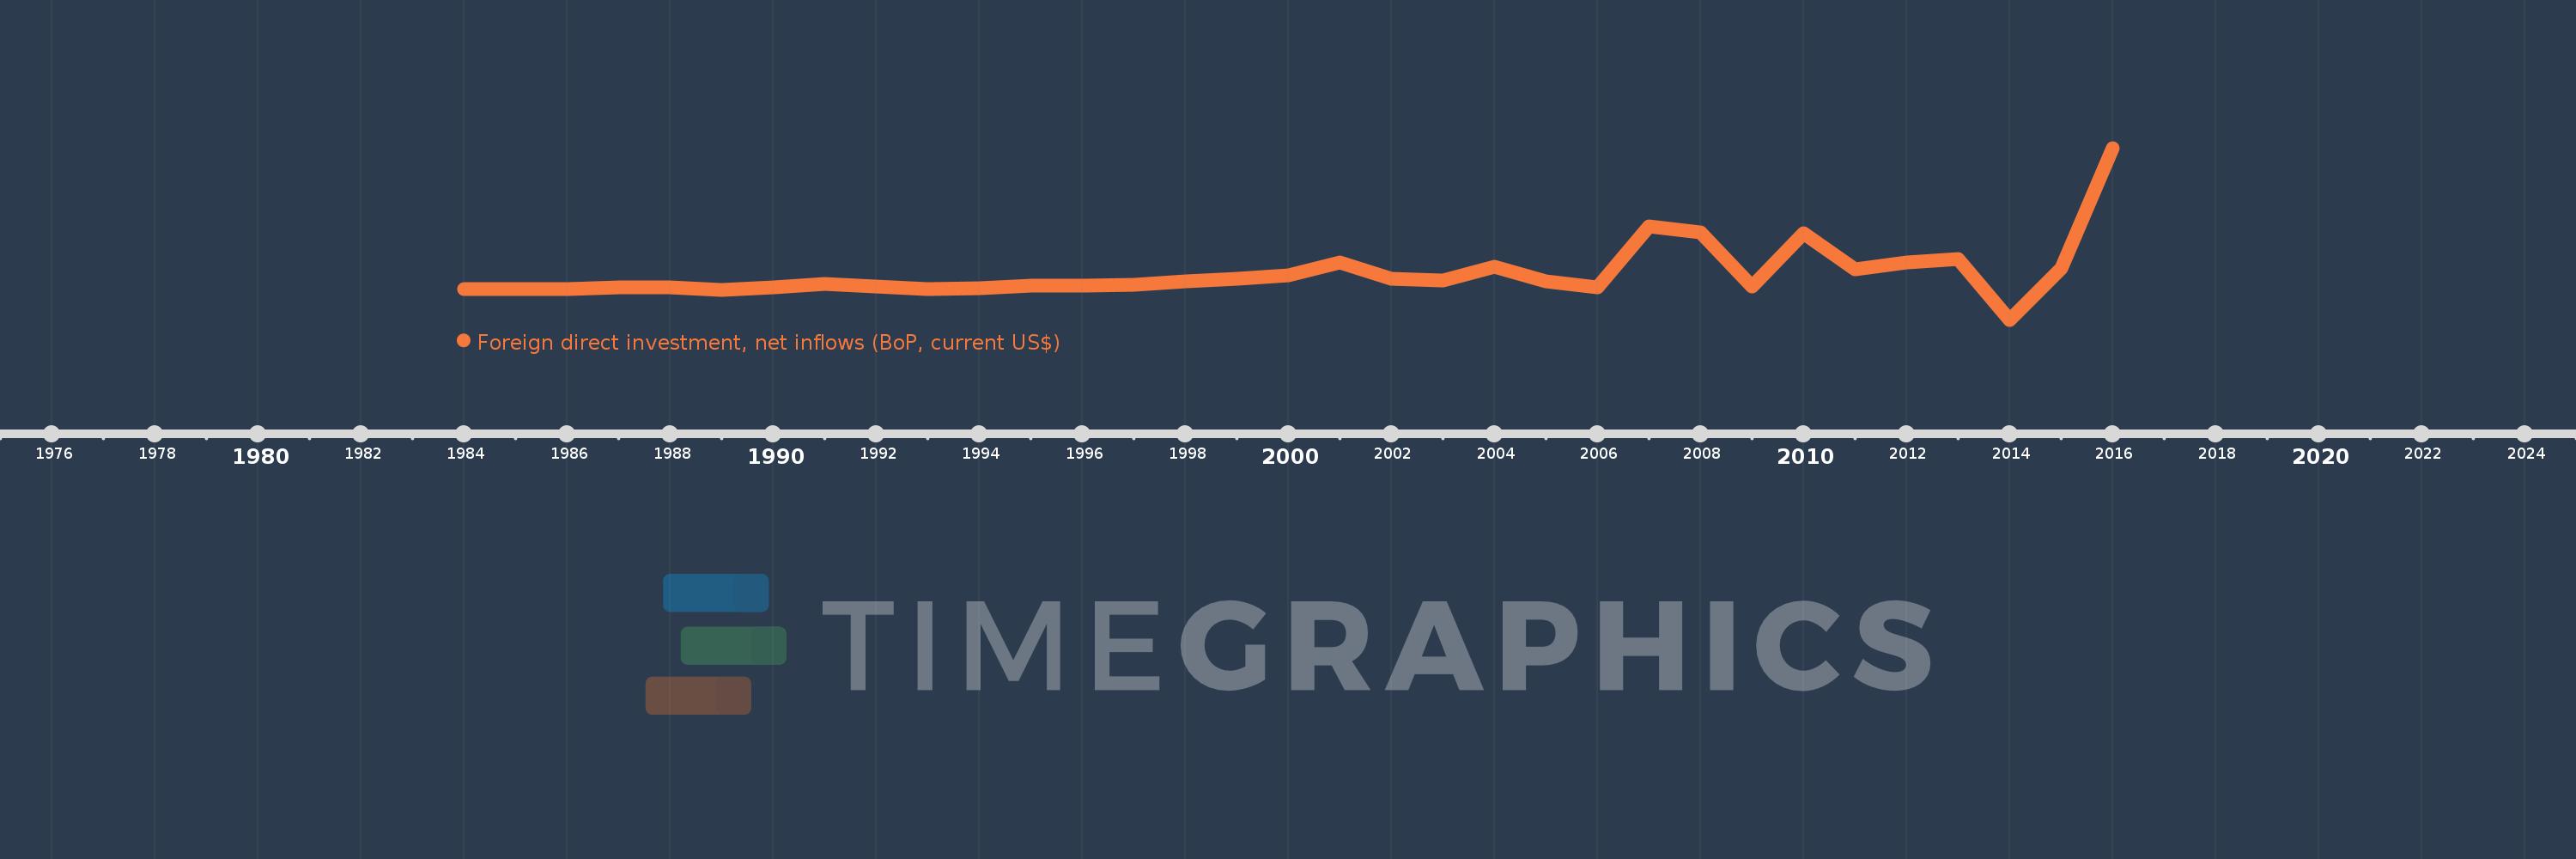
Foreign direct investment, net inflows (BoP, current US$)
2016,2015,2014,2013,2012,2011,2010,2009,2008,2007,2006,2005,2004,2003,2002,2001,2000,1999,1998,1997,1996,1995,1994,1993,1992,1991,1990,1989,1988,1987,1986,1985,1984
This statistics in other country:
AfghanistanAlbaniaAlgeriaAngolaAntigua and BarbudaArab WorldArgentinaArmeniaArubaAustraliaAustriaAzerbaijanBahamas, TheBahrainBangladeshBarbadosBelarusBelgiumBelizeBeninBermudaBhutanBoliviaBosnia and HerzegovinaBotswanaBrazilBritish Virgin IslandsBrunei DarussalamBulgariaBurkina FasoBurundiCabo VerdeCambodiaCameroonCanadaCaribbean small statesCayman IslandsCentral African RepublicCentral Europe and the BalticsChadChileChinaColombiaComorosCongo, Dem. Rep.Congo, Rep.Costa RicaCote d'IvoireCroatiaCuracaoCyprusCzech RepublicDenmarkDjiboutiDominicaDominican RepublicEarly-demographic dividendEast Asia & PacificEast Asia & Pacific (excluding high income)East Asia & Pacific (IDA & IBRD countries)EcuadorEgypt, Arab Rep.El SalvadorEquatorial GuineaEritreaEstoniaEthiopiaEuro areaEurope & Central AsiaEurope & Central Asia (excluding high income)Europe & Central Asia (IDA & IBRD countries)European UnionFijiFinlandFragile and conflict affected situationsFranceFrench PolynesiaGabonGambia, TheGeorgiaGermanyGhanaGibraltarGreeceGrenadaGuatemalaGuineaGuinea-BissauGuyanaHaitiHeavily indebted poor countries (HIPC)High incomeHondurasHong Kong SAR, ChinaHungaryIBRD onlyIcelandIDA & IBRD totalIDA blendIDA onlyIDA totalIndiaIndonesiaIran, Islamic Rep.IraqIrelandIsraelItalyJamaicaJapanJordanKazakhstanKenyaKiribatiKorea, Dem. People’s Rep.Korea, Rep.KosovoKuwaitKyrgyz RepublicLao PDRLate-demographic dividendLatin America & Caribbean Latin America & Caribbean (excluding high income)Latin America & the Caribbean (IDA & IBRD countries)LatviaLeast developed countries: UN classificationLebanonLesothoLiberiaLibyaLithuaniaLow & middle incomeLow incomeLower middle incomeLuxembourgMacao SAR, ChinaMacedonia, FYRMadagascarMalawiMalaysiaMaldivesMaliMaltaMarshall IslandsMauritaniaMauritiusMexicoMicronesia, Fed. Sts.Middle East & North AfricaMiddle East & North Africa (excluding high income)Middle East & North Africa (IDA & IBRD countries)Middle incomeMoldovaMongoliaMontenegroMoroccoMozambiqueMyanmarNamibiaNauruNepalNetherlandsNew CaledoniaNew ZealandNicaraguaNigerNigeriaNorth AmericaNorthern Mariana IslandsNorwayOECD membersOmanOther small statesPacific island small statesPakistanPalauPanamaPapua New GuineaParaguayPeruPhilippinesPolandPortugalPost-demographic dividendPre-demographic dividendQatarRomaniaRussian FederationRwandaSamoaSao Tome and PrincipeSaudi ArabiaSenegalSerbiaSeychellesSierra LeoneSingaporeSint Maarten (Dutch part)Slovak RepublicSloveniaSmall statesSolomon IslandsSomaliaSouth AfricaSouth AsiaSouth Asia (IDA & IBRD)South SudanSpainSri LankaSt. Kitts and NevisSt. LuciaSt. Vincent and the GrenadinesSub-Saharan Africa Sub-Saharan Africa (excluding high income)Sub-Saharan Africa (IDA & IBRD countries)SudanSurinameSwazilandSwedenSwitzerlandSyrian Arab RepublicTajikistanTanzaniaThailandTimor-LesteTogoTongaTrinidad and TobagoTunisiaTurkeyTurkmenistanTuvaluUgandaUkraineUnited Arab EmiratesUnited KingdomUnited StatesUpper middle incomeUruguayUzbekistanVanuatuVenezuela, RBVietnamWest Bank and GazaWorldYemen, Rep.ZambiaZimbabwe Timeline:
This timeline shows a graph from 1984 to 2016 of Switzerland. No data until 1983. Number of actual observations by date: 33.
Source name:
World Development Indicators
Source organization:
International Monetary Fund, Balance of Payments database, supplemented by data from the United Nations Conference on Trade and Development and official national sources.
Categories, topics:
Economy & Growth, Financial Sector, External Debt
Last updated:
apr 23, 2017
Indicators value changes by year
Minimum:
-24.898 bln
jan 1, 2014
Maximum:
119.714 bln
jan 1, 2016
At the date of observation
Value
Absolute change
Change from previous value
jan 1, 1984
642.644 mln
+642.644 mln
0.0%
jan 1, 1985
777.126 mln
+134.482 mln
20.93%
jan 1, 1986
1.267 bln
+490.209 mln
63.08%
jan 1, 1987
2.122 bln
+855.054 mln
67.47%
jan 1, 1988
2.32 bln
+197.903 mln
9.32%
jan 1, 1989
405.248 mln
-1.915 bln
-82.53%
jan 1, 1990
2.497 bln
+2.092 bln
516.21%
jan 1, 1991
5.545 bln
+3.048 bln
122.04%
jan 1, 1992
2.839 bln
-2.706 bln
-48.8%
jan 1, 1993
1.128 bln
-1.71 bln
-60.25%
jan 1, 1994
1.707 bln
+578.45 mln
51.26%
jan 1, 1995
3.683 bln
+1.976 bln
115.75%
jan 1, 1996
4.158 bln
+475.549 mln
12.91%
jan 1, 1997
4.373 bln
+214.694 mln
5.16%
jan 1, 1998
7.306 bln
+2.933 bln
67.08%
jan 1, 1999
9.649 bln
+2.343 bln
32.07%
jan 1, 2000
12.426 bln
+2.777 bln
28.78%
jan 1, 2001
23.081 bln
+10.655 bln
85.75%
jan 1, 2002
9.765 bln
-13.316 bln
-57.69%
jan 1, 2003
8.258 bln
-1.507 bln
-15.43%
jan 1, 2004
19.721 bln
+11.463 bln
138.81%
jan 1, 2005
7.102 bln
-12.619 bln
-63.99%
jan 1, 2006
2.665 bln
-4.437 bln
-62.48%
jan 1, 2007
53.761 bln
+51.096 bln
1.92K%
jan 1, 2008
48.688 bln
-5.072 bln
-9.44%
jan 1, 2009
2.991 bln
-45.697 bln
-93.86%
jan 1, 2010
47.659 bln
+44.668 bln
1.49K%
jan 1, 2011
17.671 bln
-29.988 bln
-62.92%
jan 1, 2012
23.198 bln
+5.527 bln
31.28%
jan 1, 2013
26.288 bln
+3.09 bln
13.32%
jan 1, 2014
-24.898 bln
-51.186 bln
-194.71%
jan 1, 2015
18.375 bln
+43.274 bln
-173.8%
jan 1, 2016
119.714 bln
+101.339 bln
551.49%
Ranking of countries by current statistics by years


Comments: